
Customer Satisfaction reporting is a built-in feature and a part of Jira Service Management reporting. Jira Service Management projects come with the customer satisfaction survey enabled to automatically start gathering feedback. It is a useful feature, especially if you use Jira Service Management for external customer support. Jira Service Management Customer Satisfaction (Jira CSAT) scores can be reported with built-in reports or externally with Excel reports.
What is a Jira Service Management customer satisfaction survey
When a ticket is resolved, Jira Service Management sends a customer satisfaction survey to the requester. The email contains options to rate the service received with 1 to 5 stars. On top of star ratings, they can also leave a comment about their experience. This feedback is displayed on the Jira Service Management ticket queue and in the Satisfaction custom field in every ticket.
The average customer satisfaction rating gives you an idea of what your customers think about your service or about the work of specific agents. You can use this feedback to improve your service in a way that is the most important to your customers.
Jira Service Management Customer Satisfaction Report
There is a built-in report for Customer Satisfaction in Jira Service Management. In that Jira CSAT report, you can see the overall performance expressed by the average rating you've got in the set time frame.
The satisfaction averages by agents can be displayed on a chart for example as a custom report. This built-in report doesn't give you many options for customization, data analysis, or trend discovery. This is where a natively exported Excel report proves to be more useful.
Create a Customer Satisfaction Excel Report
- Go to Advanced issue search in Jira Service Management, and run a JQL query to filter your tickets. You can get the whole project, or you can filter for a date range, agents, request types, etc.
- Click on the Excel export icon to open the export options menu.
- Choose Customer Satisfaction (CSAT) Report.
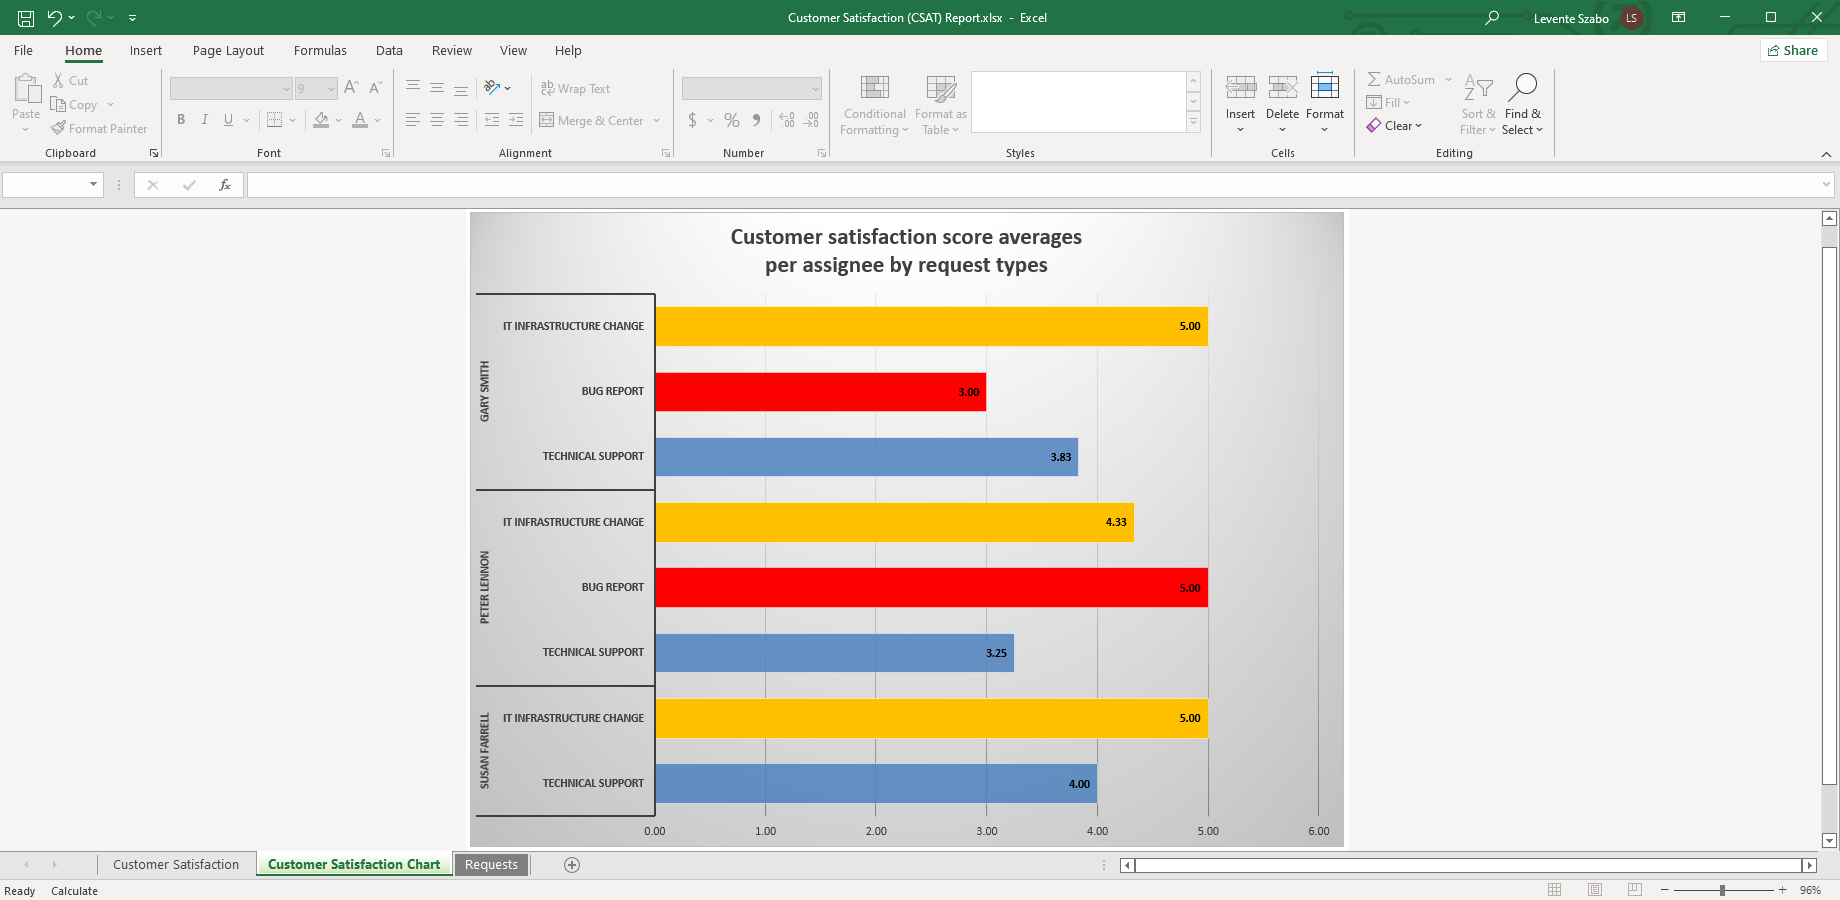
- Open the downloaded file in Excel and see the result.
Insights in the Customer Satisfaction Excel Report
Better Excel Exporter's Customer Satisfaction Report includes the issues set by the filters in Advanced issue search. It also contains a pivot table and a pivot chart that are already populated with the relevant Jira Service Management tickets.
This gives you more insight and flexibility in building the report you need. You can add more fields to the pivot table that you could not do in Jira Service Management built-in reports. For example, you can group by Reporter (the customer, in a Customer Service project), not just Assignee. These changes you make on the pivot table will be reflected on the pivot chart.
You can discover insights like these with the Jira Service Management Customer Satisfaction report:
-
Check the ratings by Reporter and/or Organization. This way you can see if there are customers who give consistently high or low ratings.
-
Check satisfaction by Urgency or Priority. If your average Customer Satisfaction is high, but your customer service has a significantly lower rating on Urgent or High priority requests, that could signify a problem with the most important questions.
-
Group the satisfaction scores by support language. If you provide support in multiple languages, this report can help discover areas of improvement in communications.
What insight are you interested in? Get this Jira CSAT report automatically when you start a free trial of Better Excel Exporter for Jira!
Create Jira Service Management customer satisfaction reports!

