
Report and analyze Jira worklogs in Excel
The worklog-report.xlsx Excel template effectively aggregates the worklogs of the issues resulted from any arbitrary JQL search. It helps to understand the total time spent on the issues, projects, issue types, versions, components, etc. grouped and filtered by date ranges, users, etc.
Pro tip: making a copy of the original template and customizing that, you can create your ideal Jira worklog report and other time-based Excel report much easier.
Next steps
- Create similar Excel reports from your own issues with the free 30-day trial!
Export samples
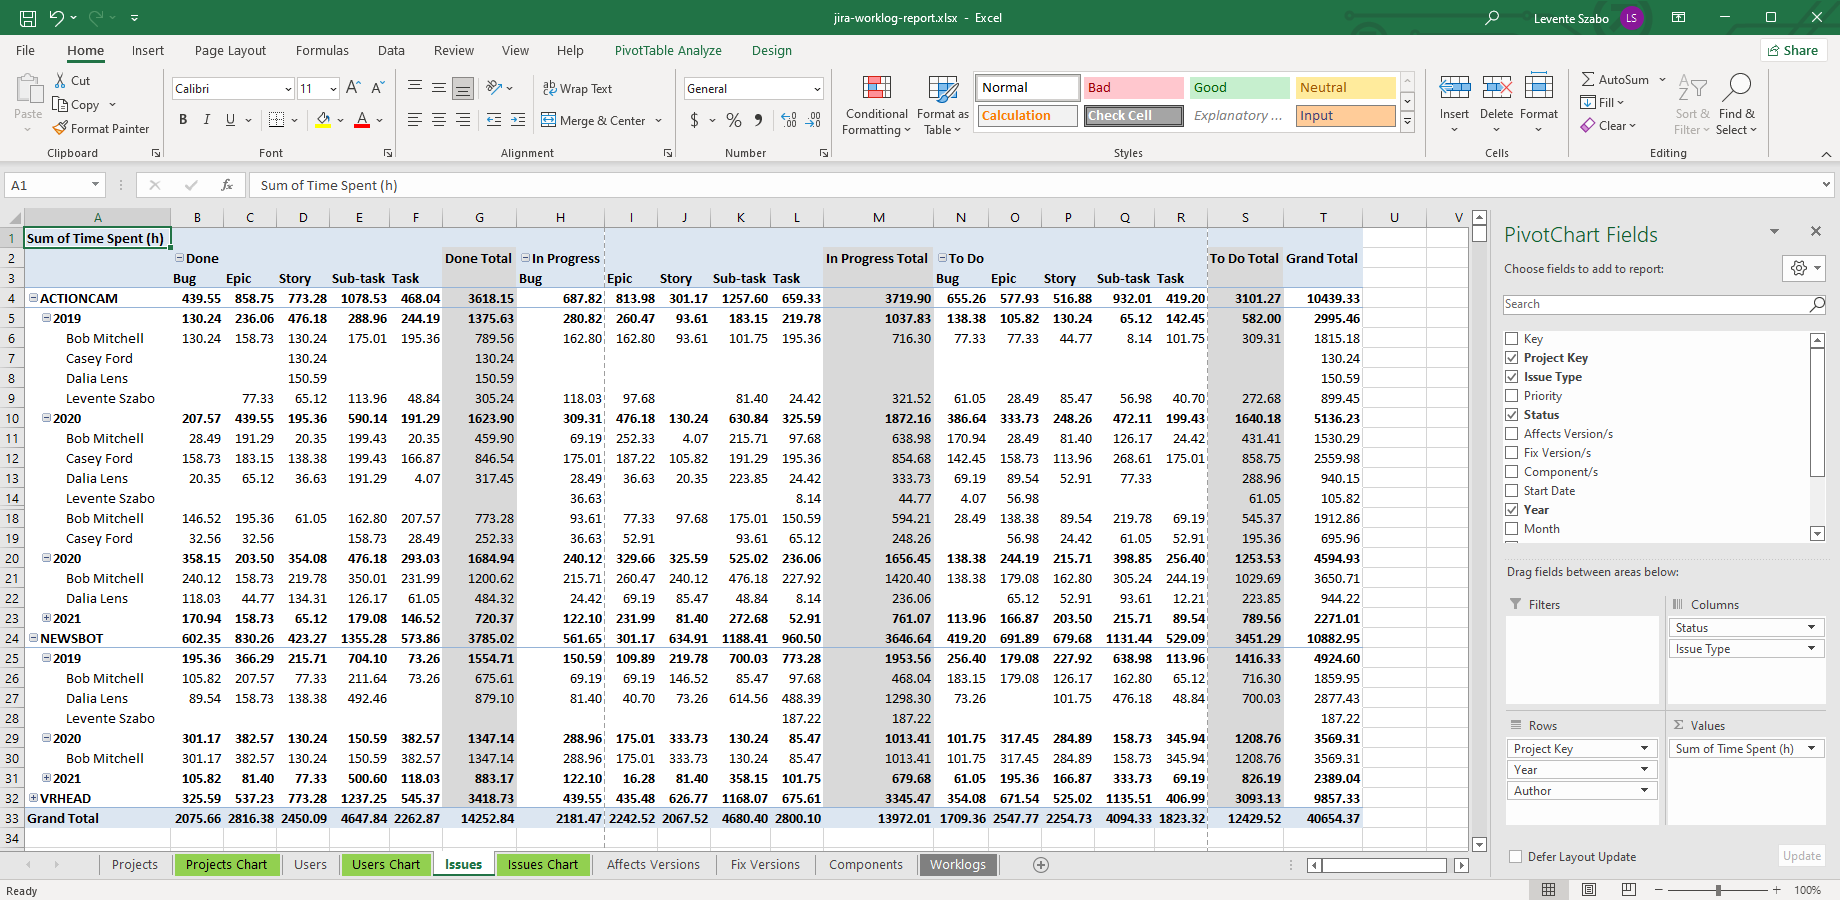
Jira worklog pivot table
This Excel export example summarizes the time spent by issue type and assignee. You can drill down to "day" level. Grand totals are available. Even this trivial example should give you a quick demo of the capabilities.
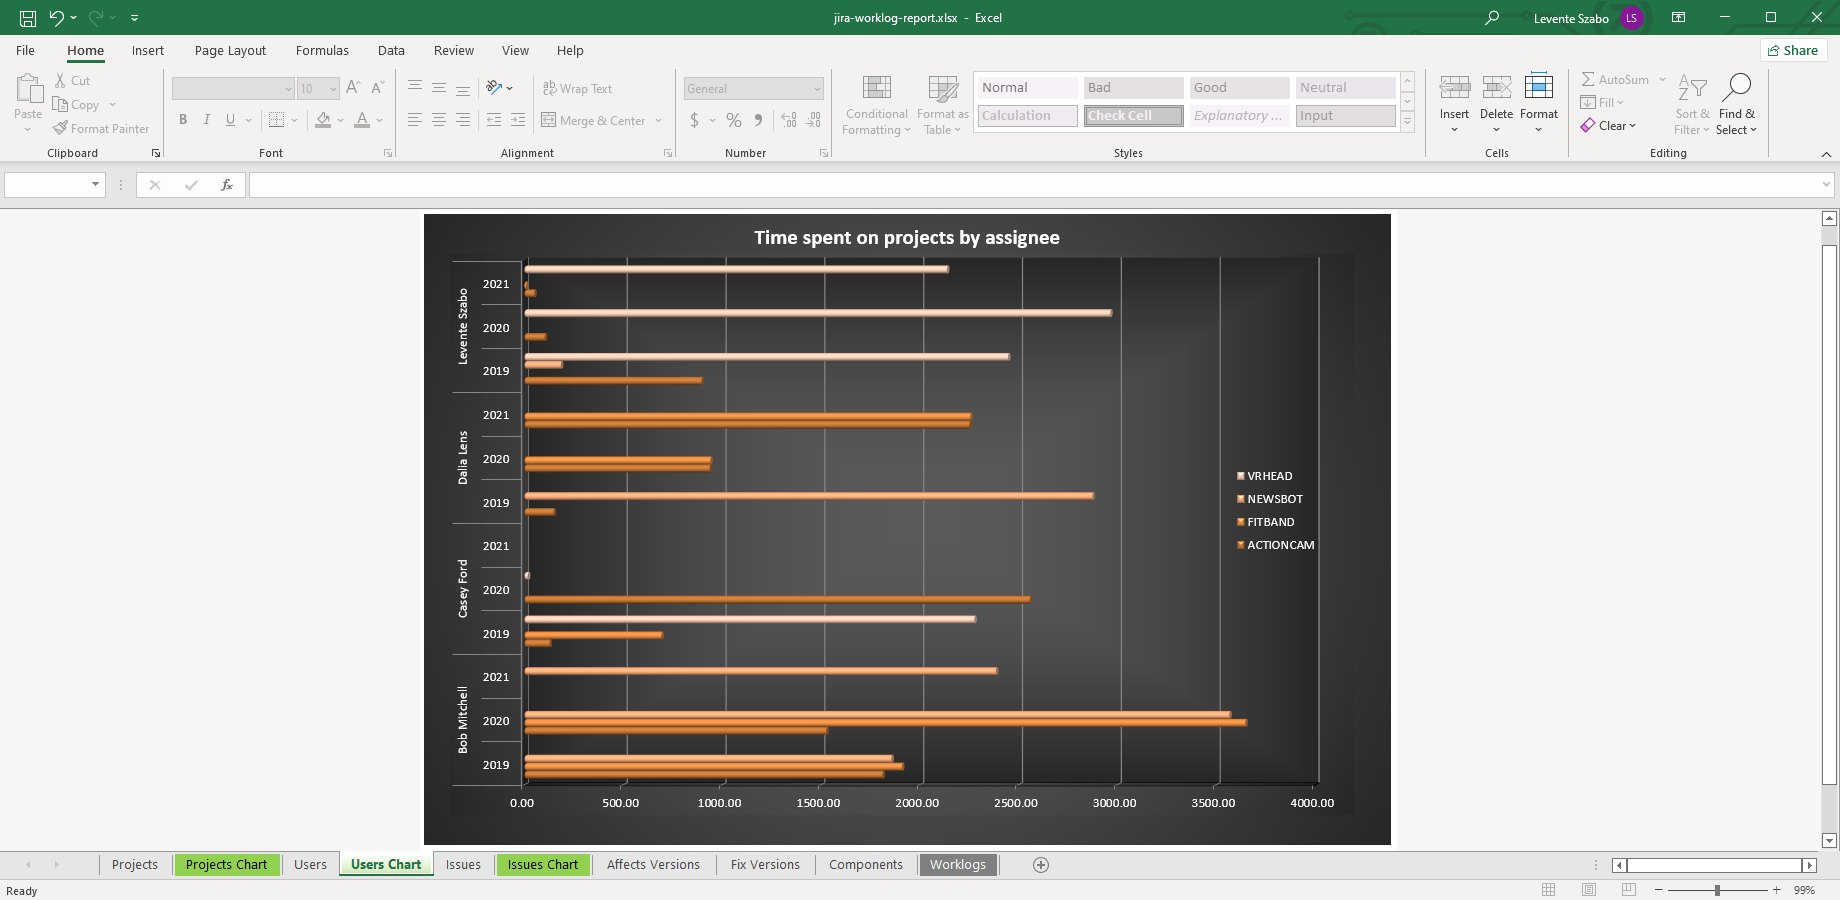
Jira worklog pivot chart
This Excel pivot chart gives you a super-fast overview of work allocation among multiple Jira projects by assignee. Please note the special chart theme (dark background with orange colored 3D bars) applied with a single click.
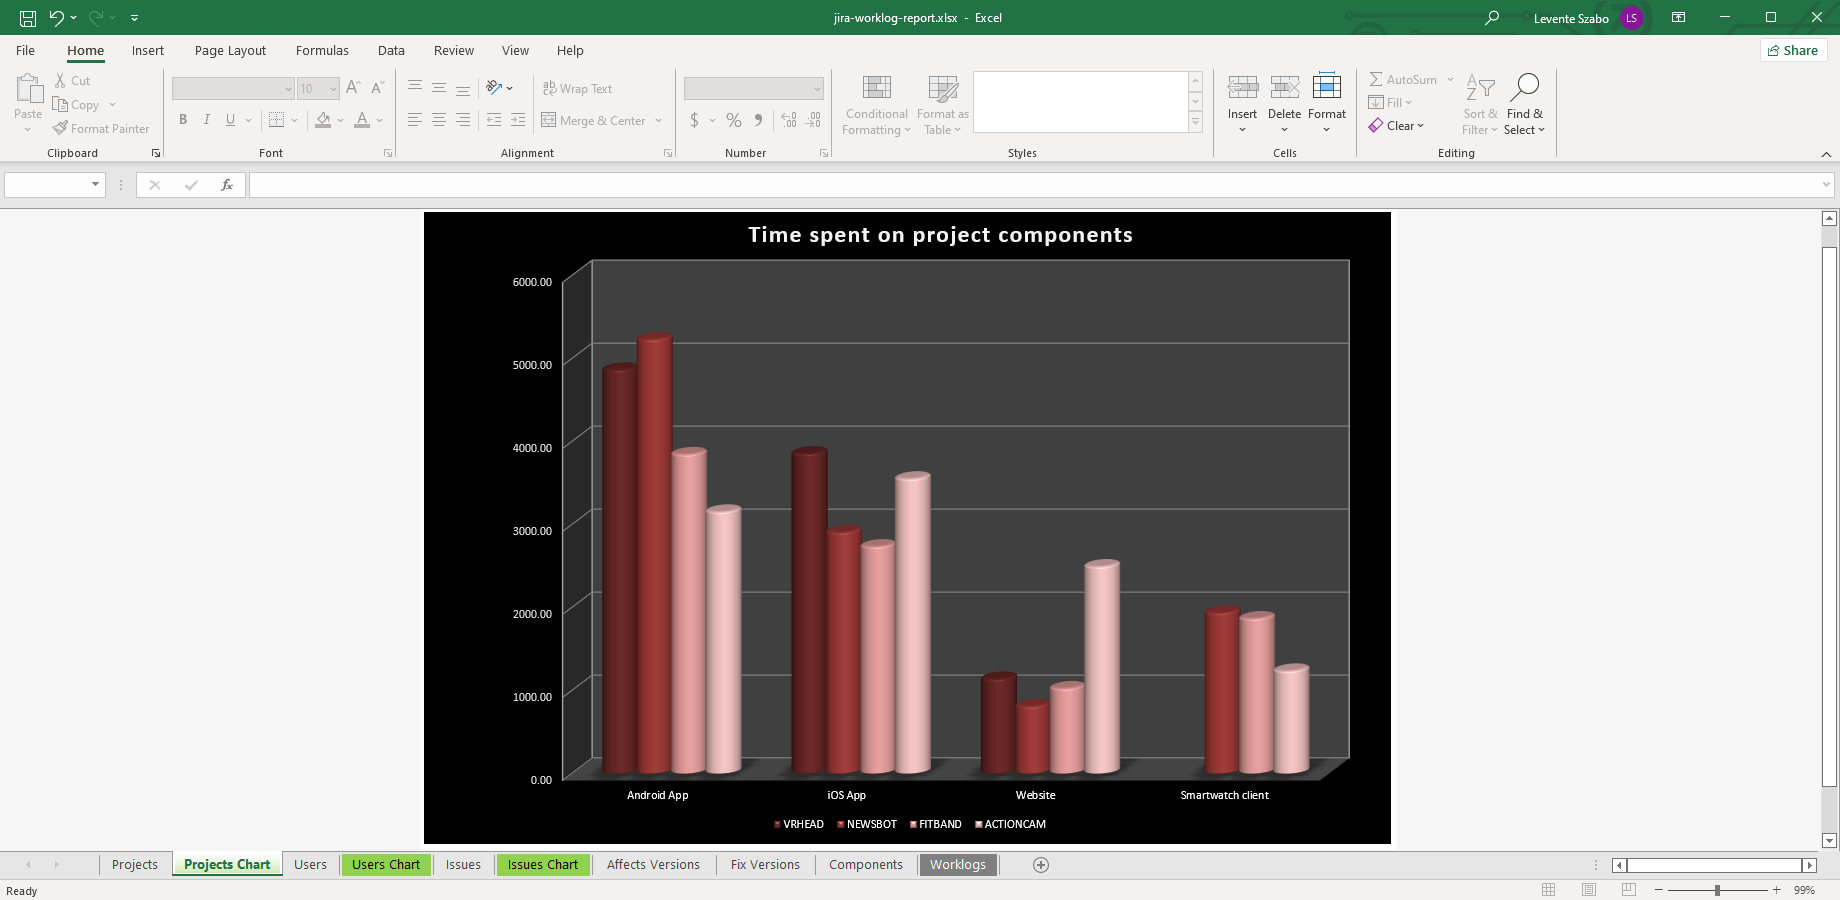
Cross-project per-component worklog report
This is an example of an Excel report that aggregates efforts by components from multiple projects, when your Jira projects have identically named components. As you see, the worklogs can be collected from any arbitrary issue list, i.e. your scope is not limited to projects or to any kind of container.