In this page
Automating code analysis processes
Continuous Integration approach
REST API approach
Programmatic interface approach
Recipes
Starting a code analysis after every changeset
Configuration
Usage
Starting a code analysis with a specific command
Configuration
Usage
Starting a code analysis build with a specific command and variables
Configuration
Usage
Popular code analyzer tools
What is Continuous Code Quality?
Continuous Code Quality, also known as Continuous Code Inspection and Continuous Static Code Analysis, means constantly analysing and scanning your code for coding style violations, bugs and vulnerabilities. Similarly to Continuous Integration, it is considered a best practice in DevOps and in agile software development.
Automating code analysis processes
Automatically starting the code analyzer tool in the background, after each change or conditionally after certain changes, enables achieving Continuous Code Quality:
To start a code analysis in a DevOps automation rule, you can take one of the three approaches described in the next sections. The best choice depends on the options offered by your code analyzer tool and on your preference if it offers multiple options.
Continuous Integration approach
If you are using Continuous Integration (CI), then it's a good idea to integrate the code analyzer tool to your CI builds. It could either become part of the "regular" build plan or become a separate build plan dedicated to code analysis. Then, starting the CI build plan will also start the code analysis.
For example, if you are using Jenkins to build your project and SonarQube to analyse your code, then integrate SonarQube to a Jenkins build plan intuitively named "Code Analysis".
For this approach:
- See the popular code analyzer tools section for the CI documentation links of various tools.
- See the Continuous Integration page for general guidance on using CI in automation rules.
- See the recipes section for step-by-step configuration guides.
REST API approach
If the code analyzer tool publishes a REST API, then you can start the code analysis by connecting to that API in the automation rule. (This approach also works if the tool offers an HTTP-based API which is not RESTful.)
For example, if you are using Checkmarx, then you can start the code analysis by creating a new scan by sending a POST request to the /sast/scans REST API endpoint.
For this approach:
- See the popular code analyzer tools section for the REST API documentation links of various tools.
- See the HTTP requests page for general guidance on calling REST API endpoints.
- See the recipes section for step-by-step configuration guides.
Programmatic interface approach
If the code analyzer tool offers some other type of interface that can be used by programs, then you can start the code analysis by using that interface in the automation rule.
For example, if you are using a code analyzer tool with a commandline interface, then you can start the code analysis by running a shellscript on the server. (Where the shell script sets up the environment, checks out the current code, then starts the code analyzer tool using the commandline client.)
For this approach:
- See the popular code analyzer tools section for useful links of various tools.
- See the scripts & programs page for running programs and scripts written in various languages.
- See the recipes section for step-by-step configuration guides.
Recipes
Starting a code analysis after every changeset
This automation starts a code analysis when a new changeset is received.
It is the simplest way to integrate code analysis to your DevOps pipeline. It will the start the code analysis exactly once per changeset (after all the commits in the changeset are already in the repository).
Configuration
Follow these steps depending on the approach you chose:
-
CI build approach:
-
Create the CI build plan that includes the code analysis.
For guidance, see the CI-related parts in your code analysis tool's documentation. -
Implement the automation that starts this CI build after every changeset.
For guidance, see the Bamboo guide, Jenkins guide, TeamCity guide or for other CI systems.
-
Create the CI build plan that includes the code analysis.
-
REST API approach:
-
Find the REST API endpoint of your code analyzer tool which starts a code analysis.
For guidance, see the REST API related parts in your code analysis tool's documentation. -
Implement the automation that calls this REST API endpoint after every changeset.
For guidance, see the HTTP request guide.
-
Find the REST API endpoint of your code analyzer tool which starts a code analysis.
-
Programmatic interface approach:
-
Develop the script that starts your code analyzer tool.
For guidance, see the commandline (or other programmatic interface) related parts in your code analysis tool's documentation. -
Implement the automation that starts this scripts after every changeset.
For guidance, see the Groovy scripts guide, Python programs guide, shell script guide, batch file guide or for other scripts and programs.
-
Develop the script that starts your code analyzer tool.
Usage
-
Create a commit with this commit message:
Fix the FOO-1 bug.
- The code analysis will be started.
Starting a code analysis with a specific command
This automation starts a code analysis when the changeset includes a commit with a commit message that contains a certain command.
It is a more flexible variant of the previous automation, because you can control whether to start the code analysis or not.
Configuration
Follow these steps depending on the approach you chose:
-
CI build approach:
-
Create the CI build plan that includes the code analysis.
For guidance, see the CI-related parts in your code analysis tool's documentation. -
Implement the automation that starts this CI build if the command is present.
For guidance, see the Bamboo guide, Jenkins guide, TeamCity guide or for other CI systems.
-
Create the CI build plan that includes the code analysis.
-
REST API approach:
-
Find the REST API endpoint of your code analyzer tool which starts a code analysis.
For guidance, see the REST API related parts in your code analysis tool's documentation. -
Implement the automation that calls this REST API endpoint if the command is present.
For guidance, see the HTTP request guide.
-
Find the REST API endpoint of your code analyzer tool which starts a code analysis.
-
Programmatic interface approach:
-
Develop the script that starts your code analyzer tool.
For guidance, see the commandline (or other programmatic interface) related parts in your code analysis tool's documentation. -
Implement the automation that starts this scripts if the command is present.
For guidance, see the Groovy scripts guide, Python programs guide, shell script guide, batch file guide or for other scripts and programs.
-
Develop the script that starts your code analyzer tool.
Usage
-
Create a commit with this commit message:
Fix the FOO-1 bug. @analyze
- The code analysis will be started.
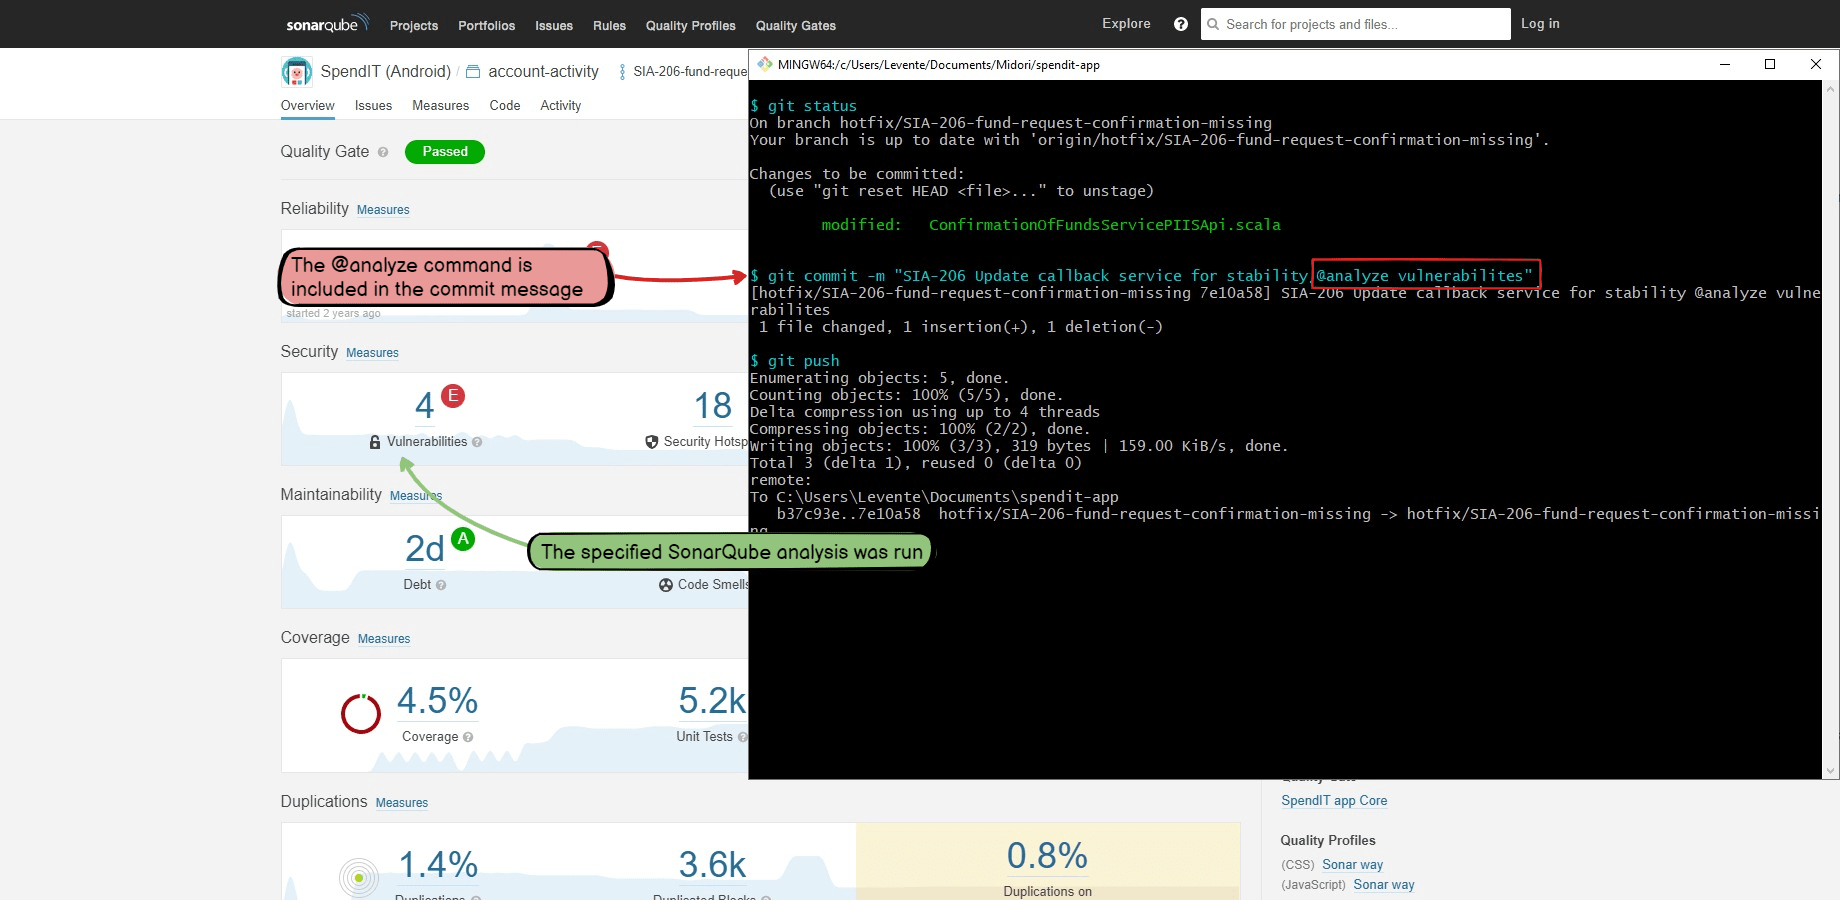
Starting a code analysis build with a specific command and variables
This automation starts a code analysis by parsing the code analysis profile name from the VCS commit message.
It is a more flexible variant of the previous automation that allows choosing the code analysis profile. Also, based on this guide, you can implement parsing any variable from the commit message and passing that to the code analyzer.
Configuration
Follow these steps depending on the approach you chose:
-
CI build approach:
-
Create the CI build plan that includes the code analysis.
For guidance, see the CI-related parts in your code analysis tool's documentation. -
Implement the automation that starts this CI build if the command and the variables are present.
For guidance, see the Bamboo guide, Jenkins guide, TeamCity guide or for other CI systems.
-
Create the CI build plan that includes the code analysis.
-
REST API approach:
-
Find the REST API endpoint of your code analyzer tool which starts a code analysis.
For guidance, see the REST API related parts in your code analysis tool's documentation. -
Implement the automation that calls this REST API endpoint if the command and the variables are present.
For guidance, see the HTTP request guide.
-
Find the REST API endpoint of your code analyzer tool which starts a code analysis.
-
Programmatic interface approach:
-
Develop the script that starts your code analyzer tool.
For guidance, see the commandline (or other programmatic interface) related parts in your code analysis tool's documentation. -
Implement the automation that starts this scripts if the command and the variables are present.
For guidance, see the Groovy scripts guide, Python programs guide, shell script guide, batch file guide or for other scripts and programs.
-
Develop the script that starts your code analyzer tool.
Usage
-
Create a commit with this commit message:
Fix the FOO-1 bug. @analyze vulnerabilities
- The code analysis will be started with the profile=vulnerabilities parameter.
Popular code analyzer tools
To save time for you, we collected some of the popular code analyzer tools below, with links to their CI integrations and API documentation.
Although we are doing our best to maintain this table, the links may be incomplete or broken. If your tool is not listed here or its links are missing, it does not mean that you can't integrate the tool to DevOps automations! We encourage searching for the terms "continuous integration", "API" and "commandline" in the tool documentation and contacting the tool's vendor in this case.
| Tool | CI integrations | REST API | Other APIs |
|---|---|---|---|
| Checkmarx | |||
| Codacy |
|
||
| Code Climate |
|
||
| Coverity |
|
|
|
| Fortify Static Code Analyzer | |||
| Klocwork |
|
||
| PVS-Studio Analyzer |
|
||
| SonarCloud |
|
||
| SonarQube | |||
| Upsource |
|
||
| Veracode |
Questions?
Ask us any time.