
In this page
Exporting Jira dashboards to PDF
Benefits of sharing Jira dashboards
Tutorial video
Exporting Jira reports to PDF (via gadgets)
Exporting Jira Software boards to PDF (via gadgets)
Dashboard export samples
Basic Jira dashboard PDF export
Weekly Jira Service Management report
Jira scrum sprint report
Jira project status report
Jira reports and agile boards
Automatic localization for dashboards & reports
Learn more about Jira dashboards
How to export Jira dashboards to PDF?
Manual exports
Automatic exports
Supported gadgets
How to ask for the full support of new gadgets?
Customizing the dashboard exports
Configuring the layout (number of columns)
Implementing custom layouts
Configuring the paper size
Configuring gadget frame colors
Advanced customization
Configuring dashboard wait time
Configuring gadget screenshot resolution
Working with gadgets in the PDF templates
Selecting the dashboards and gadgets to export
How can I find out the ID of a gadget?
Overview
Exporting Jira dashboards to PDF
Jira dashboards are great tools to summarize information in a single screen composed of gadgets, compact configurable boxes which present one specific type of information. A gadget can contain a list of issues, a graphical chart, an activity stream, or some other type of key data in a quick-to-understand format.
Dashboards are, however, not suitable for sharing with others outside the Jira web interface:
- They cannot be exported to document files (like Word or PDF).
- They are difficult to print in good quality (browsers have difficulties with layouting the dashboard page to printed pages).
- Exporting them to image files has numerous drawbacks: texts cannot be copied from the image, links are not clickable in the image, etc.
This article describes a powerful method to export Jira dashboards to PDF documents using the Better PDF Exporter app.
The resulted PDF files can be shared, emailed, archived, printed, or even further edited, just like any other electronic business document. They are also highly customizable: not only you can show or hide certain gadgets, add your company branding (logo and colors), or change the layout, you can also mix Jira gadgets with any other type of information within the same PDF.
Benefits of sharing Jira dashboards
Here are some examples, how dashboard exports will improve the efficiency of your team:
- Share Jira reports with your customers without giving them access to your Jira and the web-based dashboards.
- Automatically send a weekly summary report to your executives every Monday morning.
- Automatically save a dashboard every night to a long-time storage in order to track the evolution of information.
Tutorial video
Watch the following video to get started quickly:

Exporting Jira reports to PDF (via gadgets)
You can also export Jira reports to PDF by exporting Jira dashboards.
How? Most of the Jira reports have their equivalent gadgets. For example, the Created vs Resolved Issues Report shows you the trend of issue creations and resolutions in a graphical chart and an additional data table. You can get the same result with a similarly configured Created vs. Resolved Gadget added to a dashboard. Then, you can export the dashboard to PDF, and now you have the Jira report in a customizable, shareable, printable form!
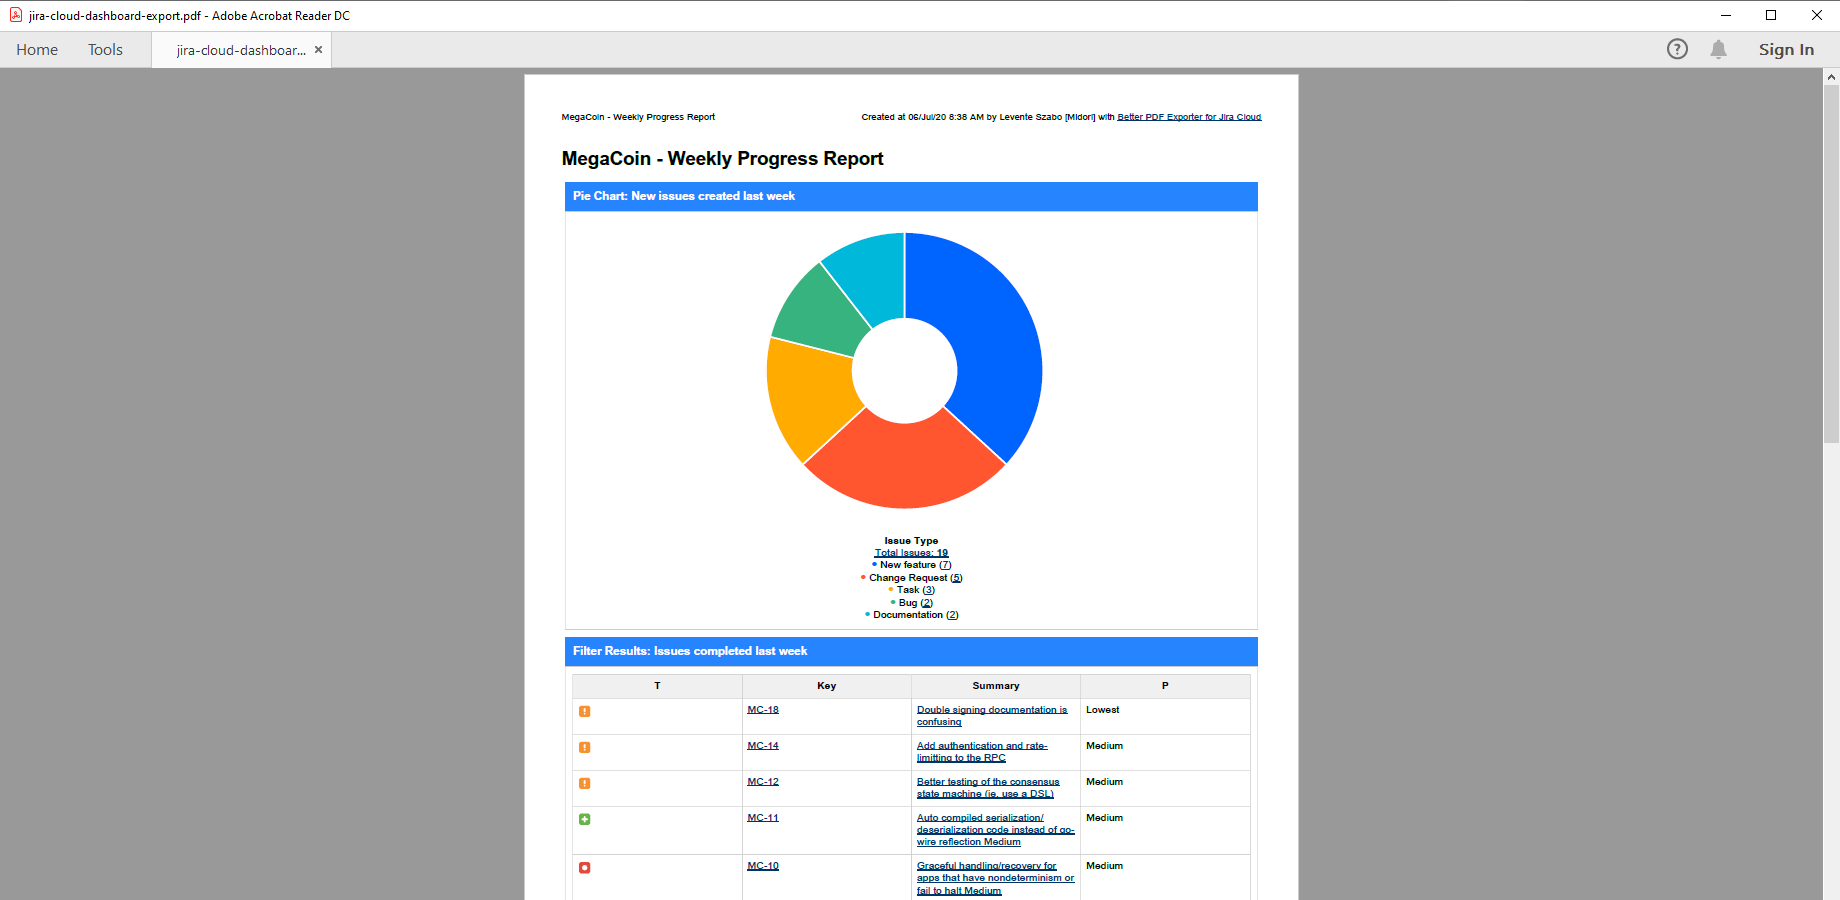
Even better, if you add multiple gadgets to the same dashboard, you can combine multiple reports to the same PDF:
Exporting Jira Software boards to PDF (via gadgets)
Similarly to reports, you can also export Jira Software boards (including Scrum, Kanban, Kanplan ones) to PDF by exporting Jira dashboards.
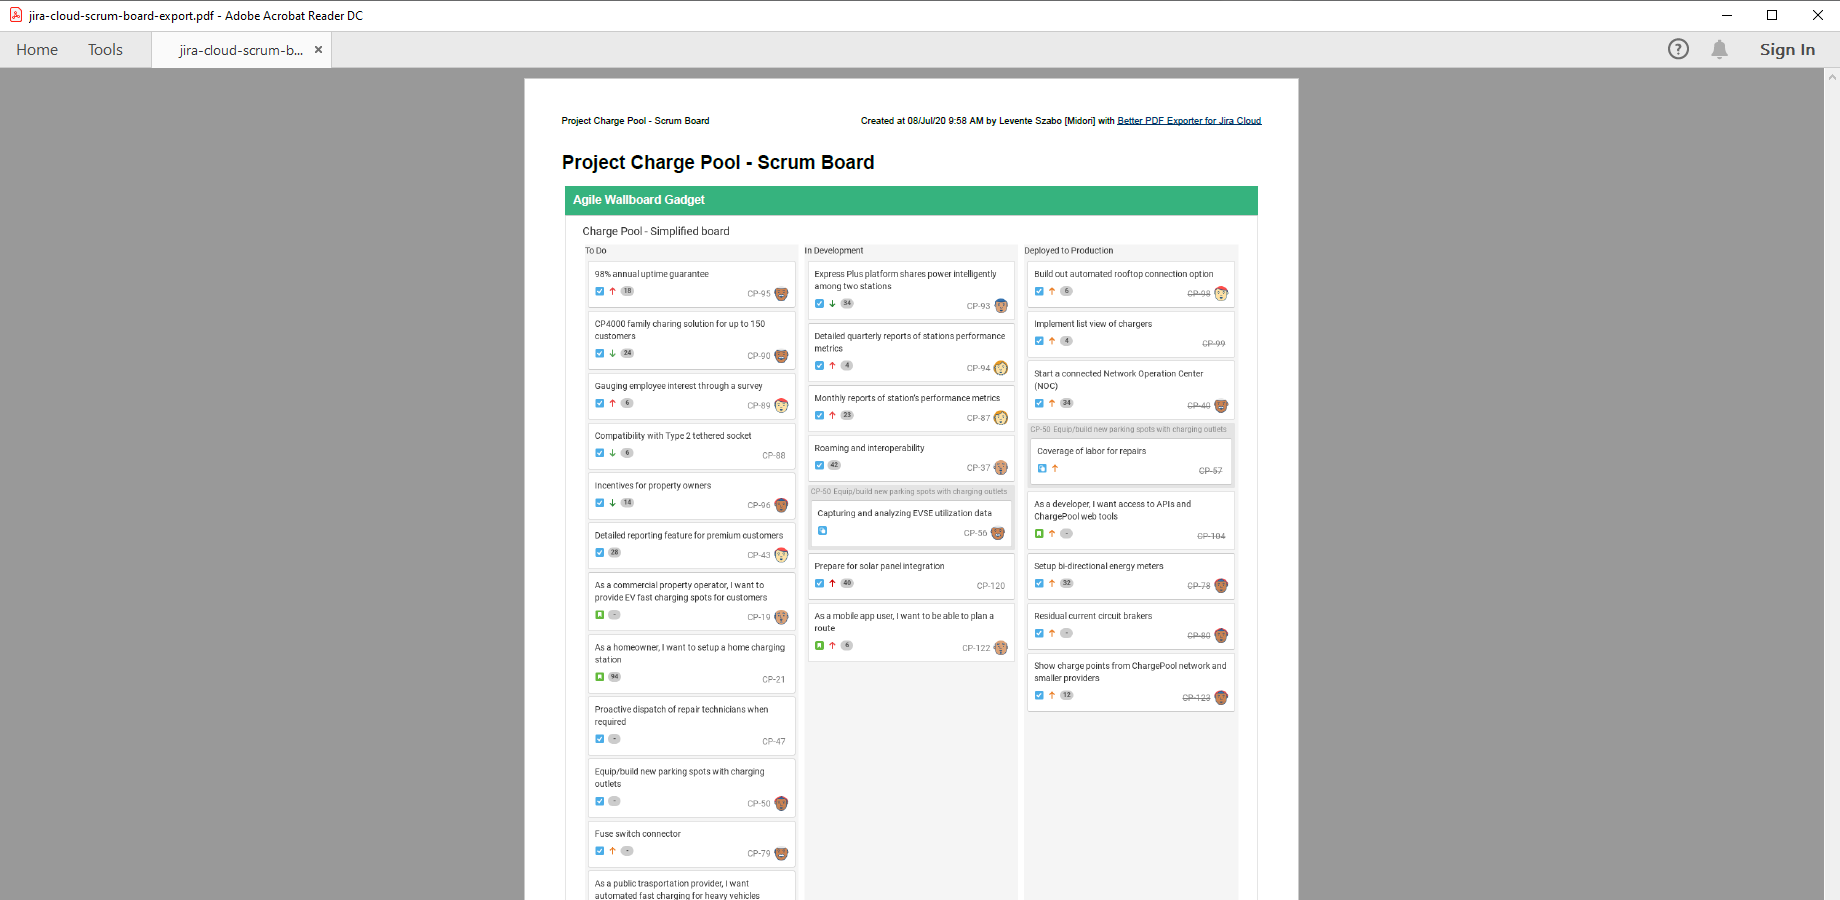
Just add the Agile Wallboard gadget to a dashboard, then export the dashboard to PDF:
Dashboard export samples
The following PDF reports should give you an idea about the possibilities:
Basic Jira dashboard PDF export
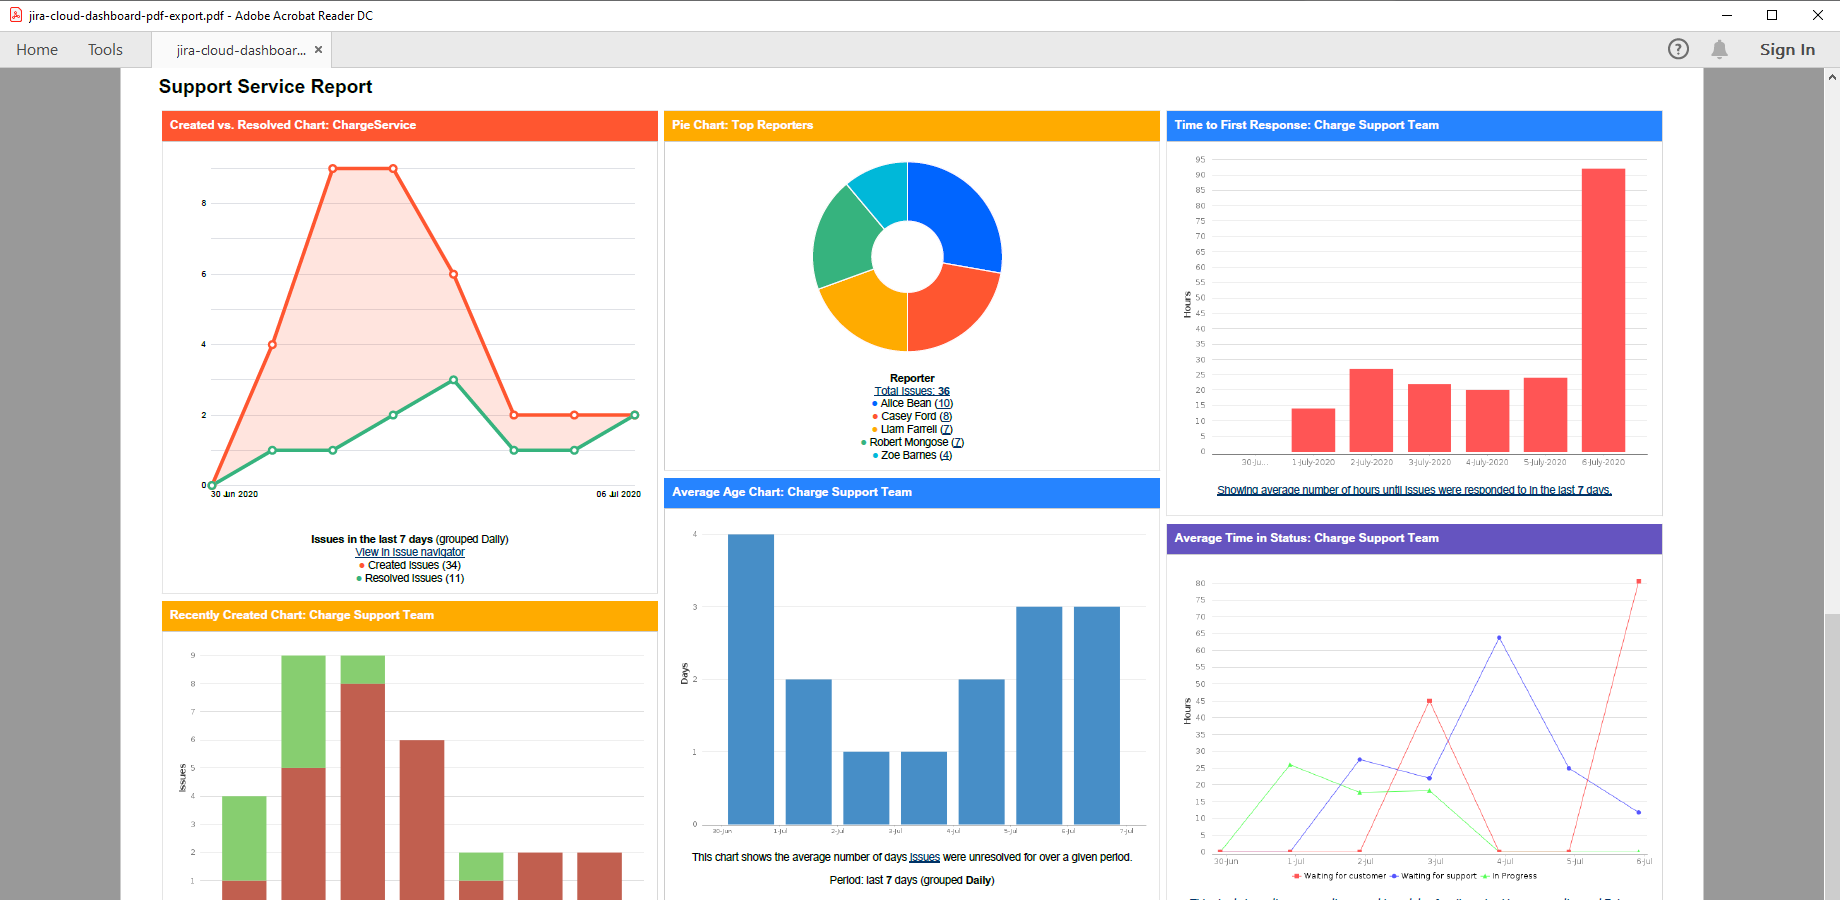
One-column, portrait-oriented export of a progress tracking dashboard, featuring the Created vs. Resolved, the Time Since Chart, the Issue Statistics, the Pie Chart and the Filter Results gadgets. You should expect this look using the default settings in the template.
Weekly Jira Service Management report
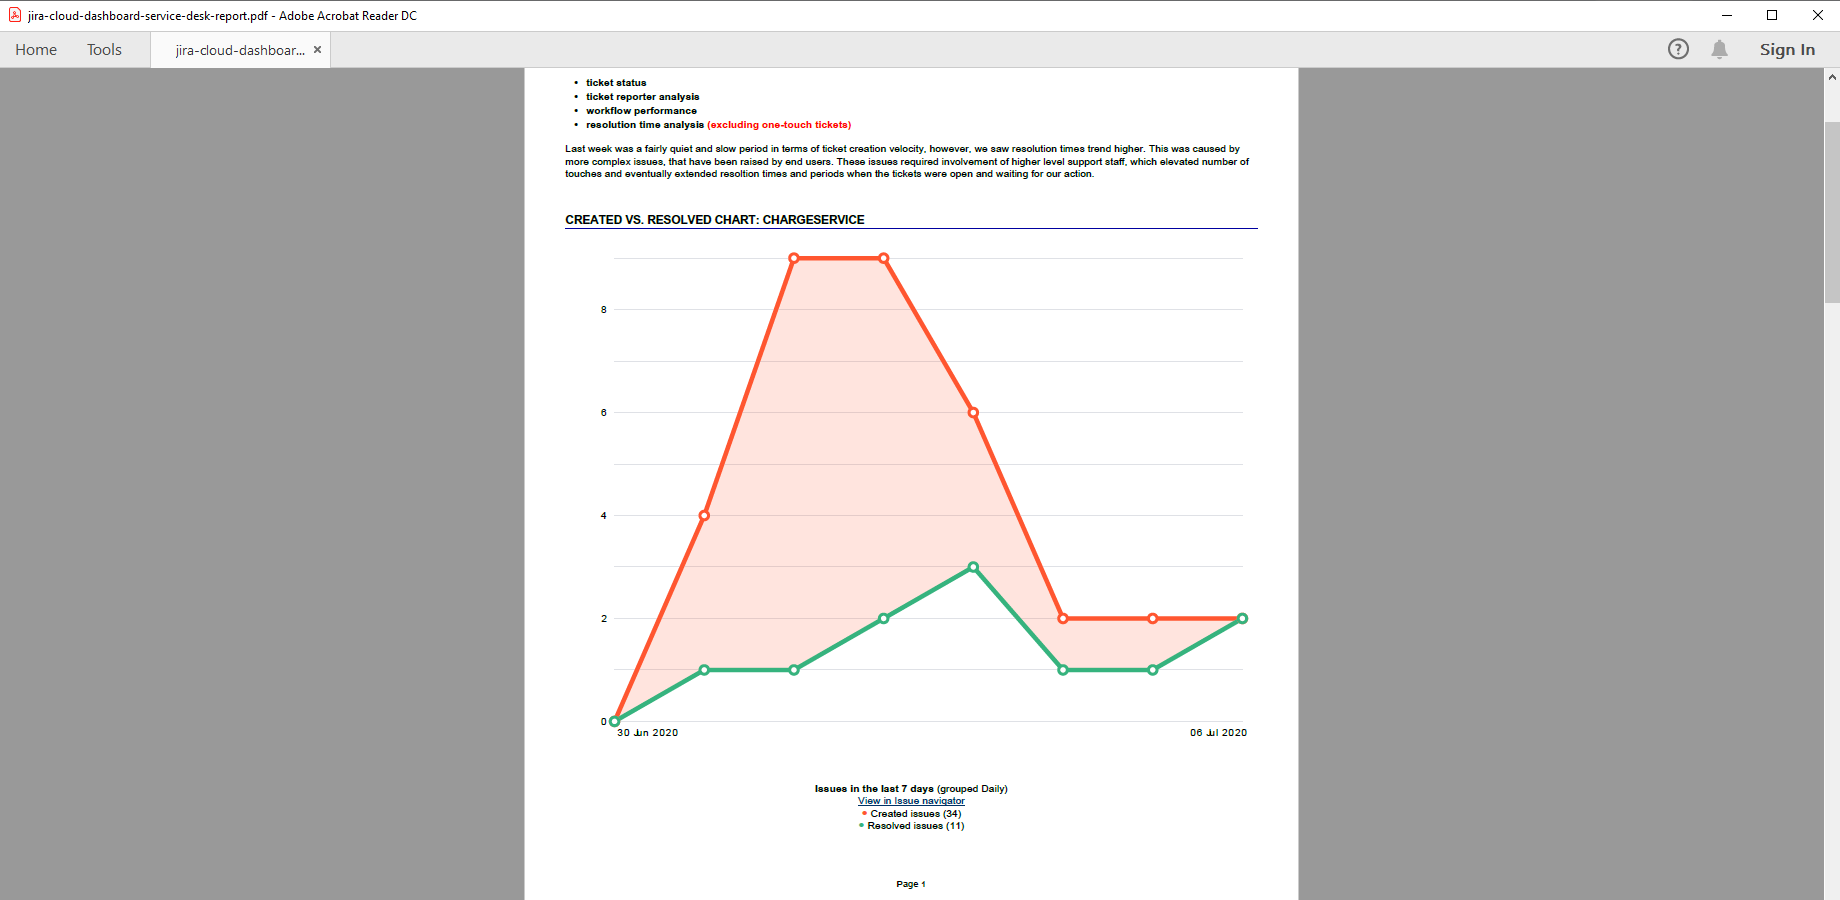
This company-branded PDF document is combining hand-written content with the visually simplified look of the Average Age Chart, the Time to First Response Chart, the Recently Created Chart, the Resolution Time and the Average Time in Status gadgets (plus others). It is, essentially, a customer-facing PDF dashboard export of Jira-sourced key performance indicators (KPIs).
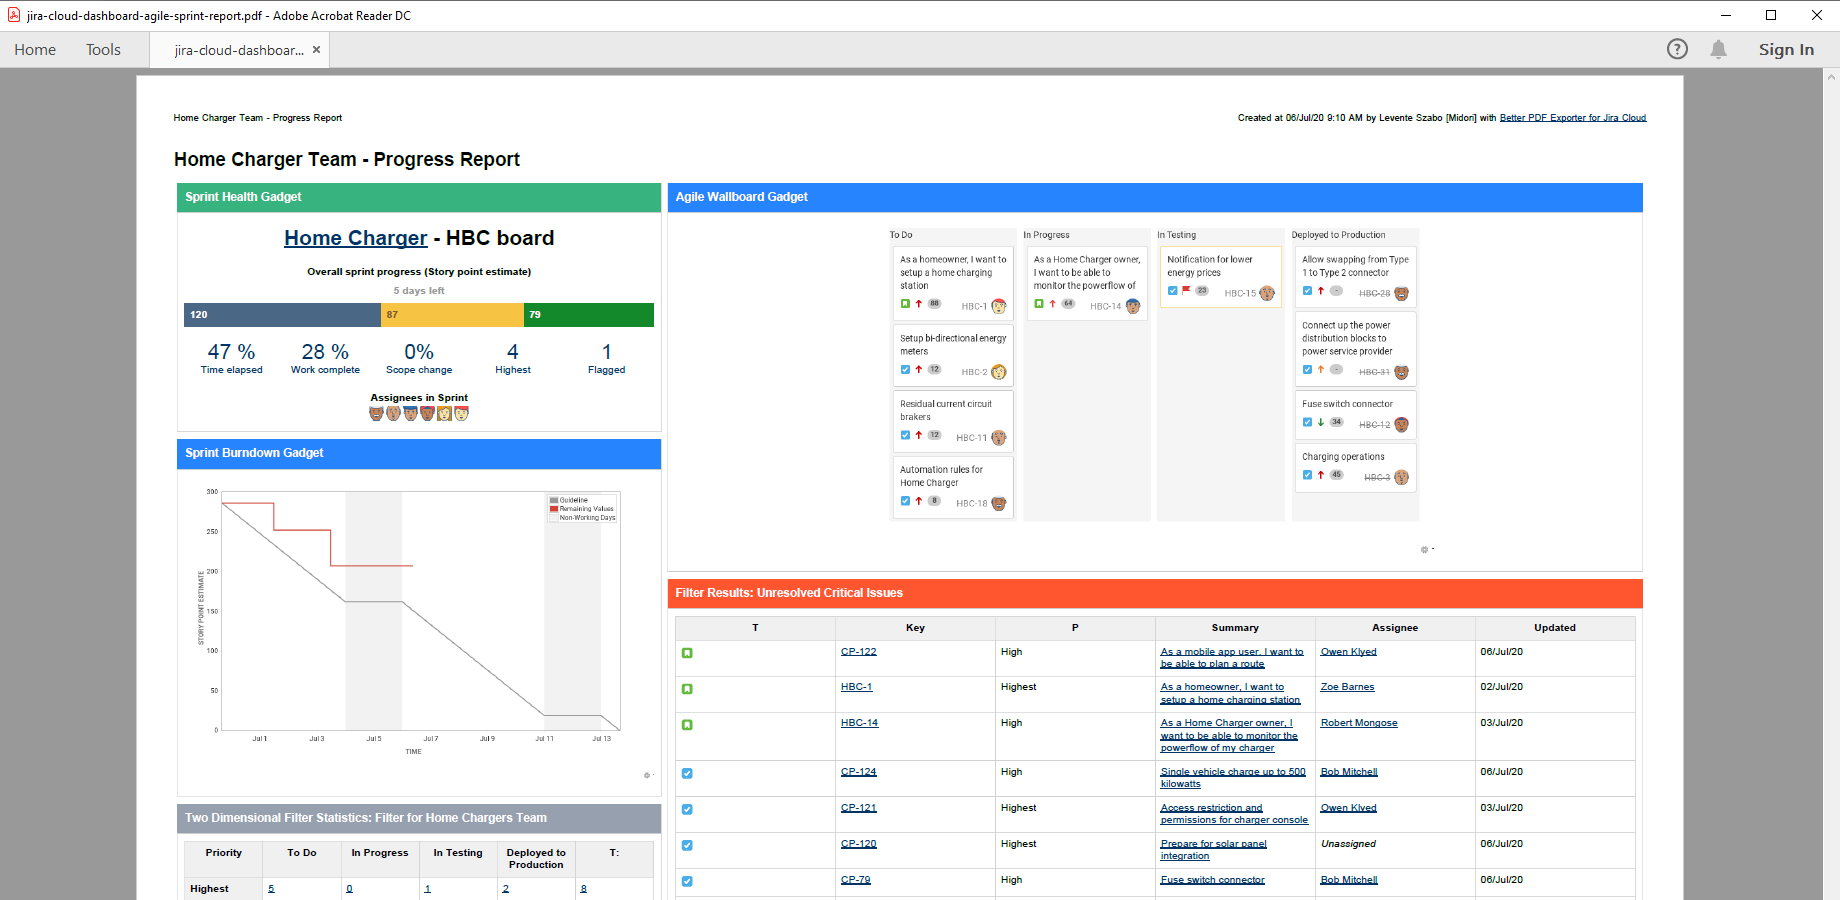
Jira scrum sprint report
This PDF export example aggregates all sprint related information into a team-focused status report (a single PDF document). In addition to Jira Core gadgets, it also contains the following Jira Software gadgets: Sprint Health, Sprint Burndown and Agile Wallboard. This is a great data source for team status reviews and daily stand-ups.
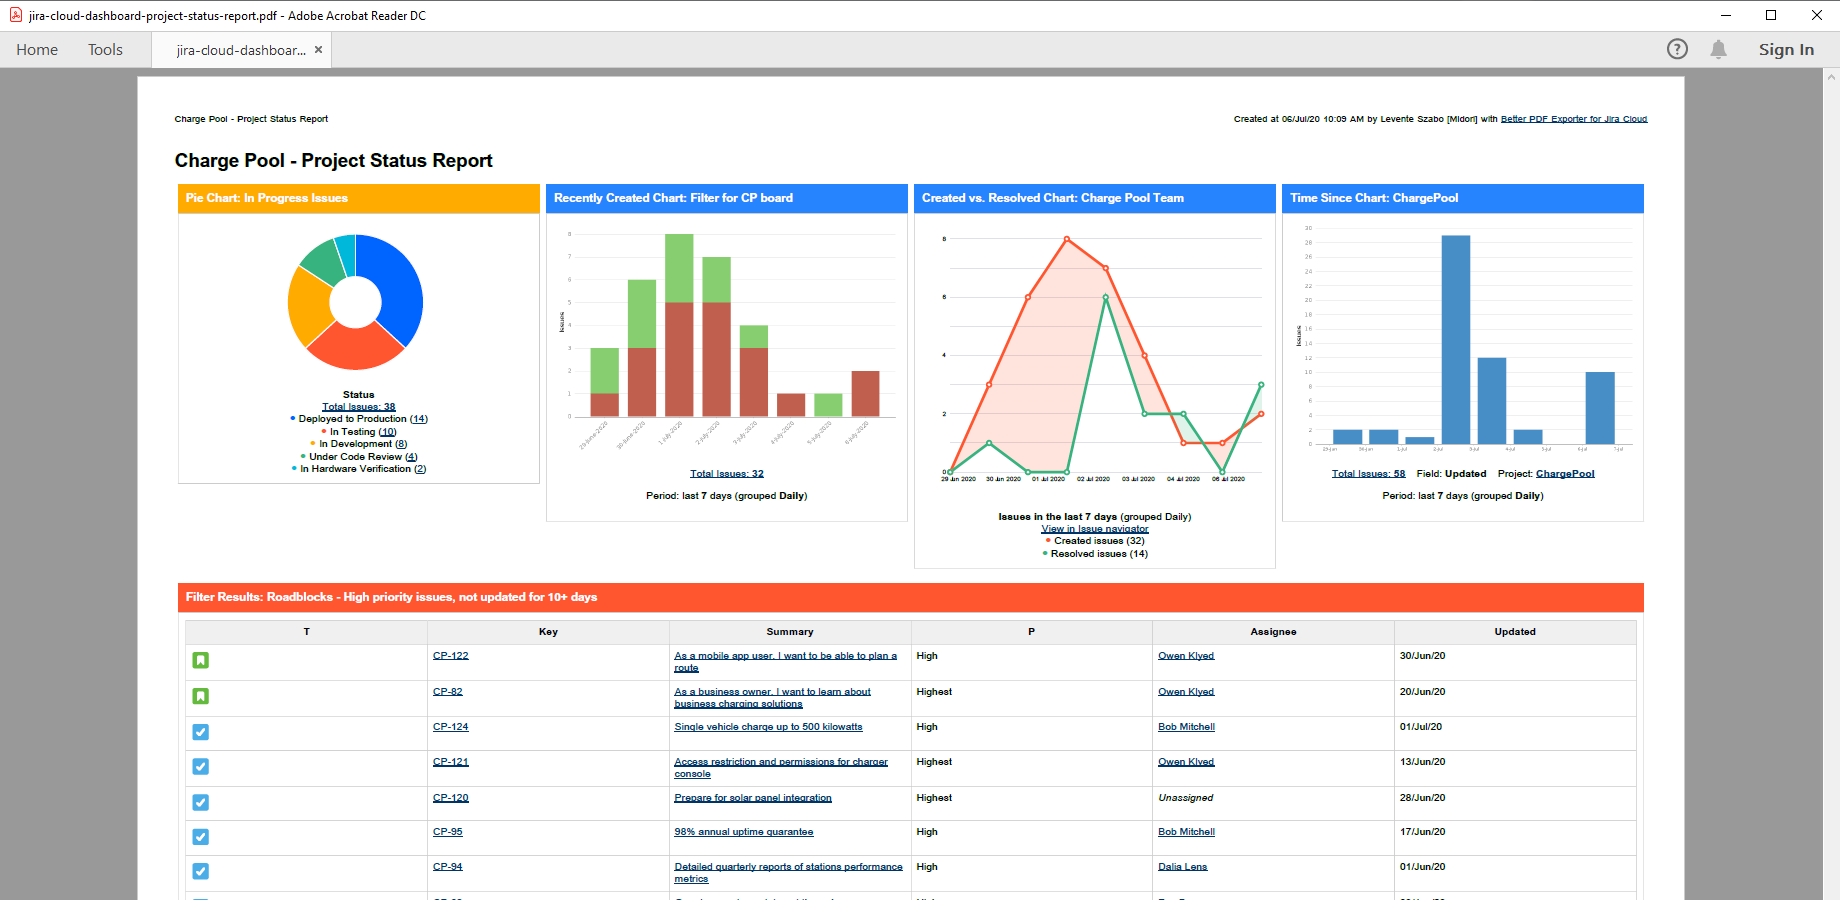
Jira project status report
This A3 landscape PDF example demonstrates using custom layouts for Jira dashboard exports: four charts give a visual explanation of the project progress in the top. Following these, a Filter Results Gadget highlights issues from the project that are potential risks and need the team's attention quickly.
Jira reports and agile boards
When you need a built-in Jira report, a Jira Software Kanban board or a Jira Software Scrum board exported to PDF (none of these are possible with Jira built-in features!), just export its dashboard gadget equivalent. This particular sample captures an ongoing Scrum sprint's board using the Agile Wallboard Gadget.
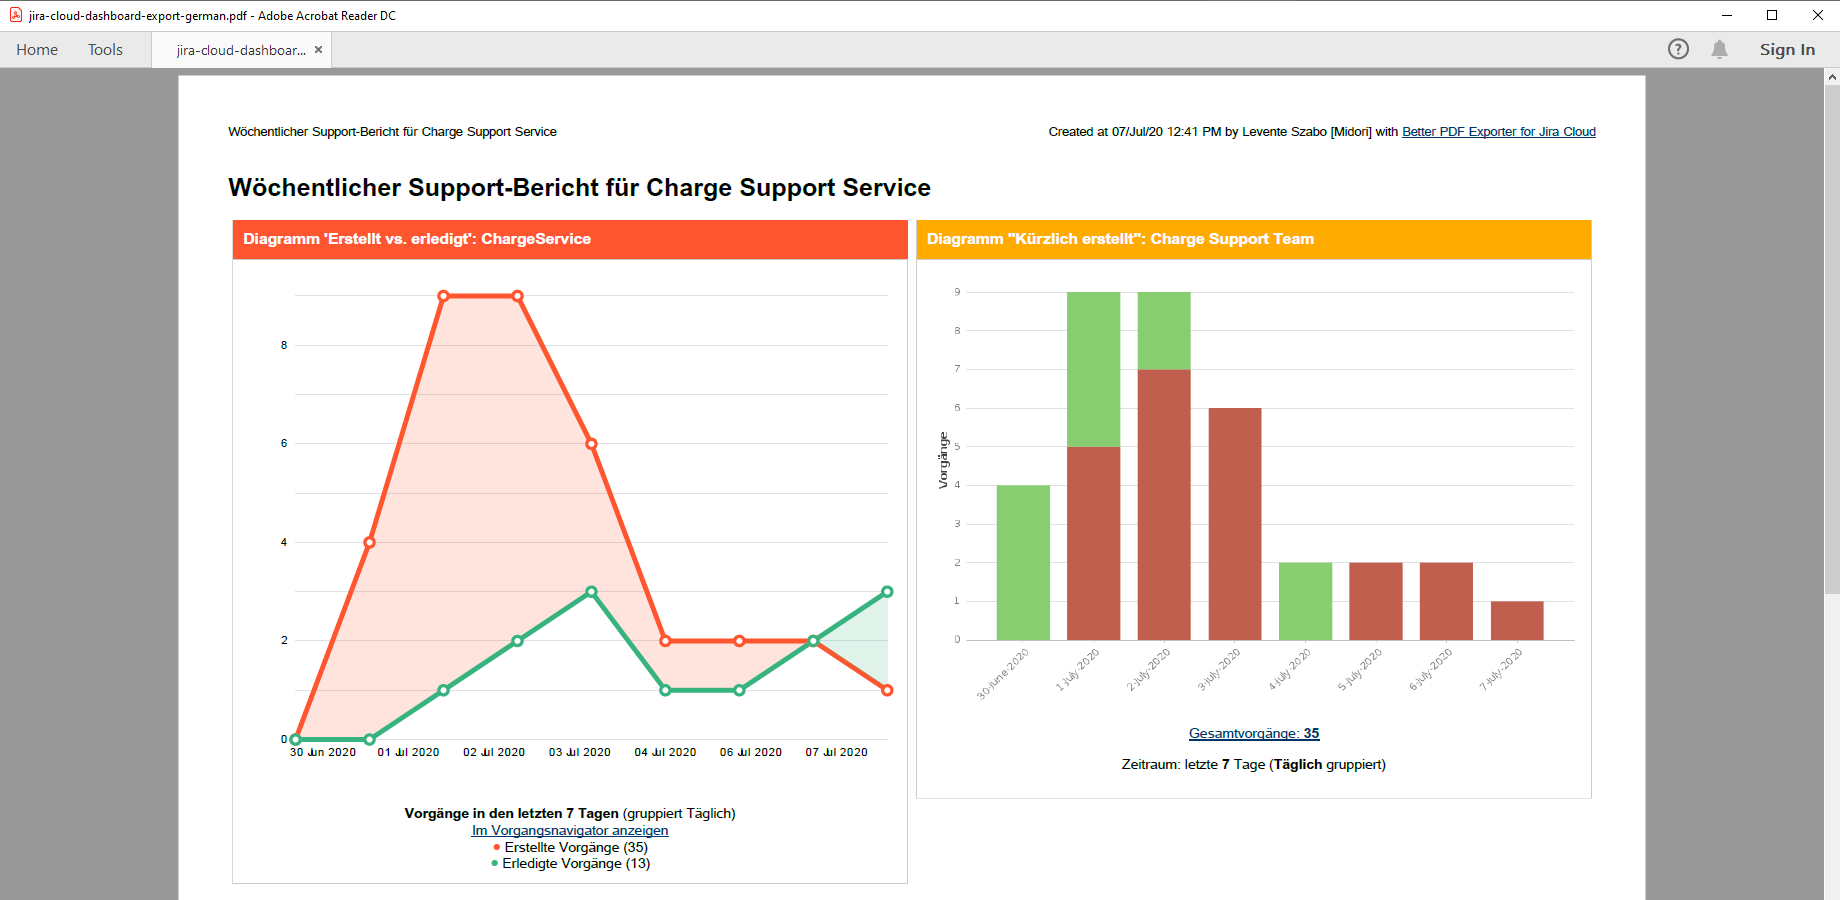
Automatic localization for dashboards & reports
Similar to all other types of Jira PDF exports, dashboard exports also use the language selected in the user's profile settings. Note that all content (including gadget titles and charts) is exported in German without any further interaction.
Learn more about Jira dashboards
See these pages in the Jira documentation:
How to export Jira dashboards to PDF?
After installing the Better PDF Exporter app, you can export dashboards manually. (Automatic exports that are available in the Server and Data Center versions of the app will come to Cloud soon!)
Manual exports
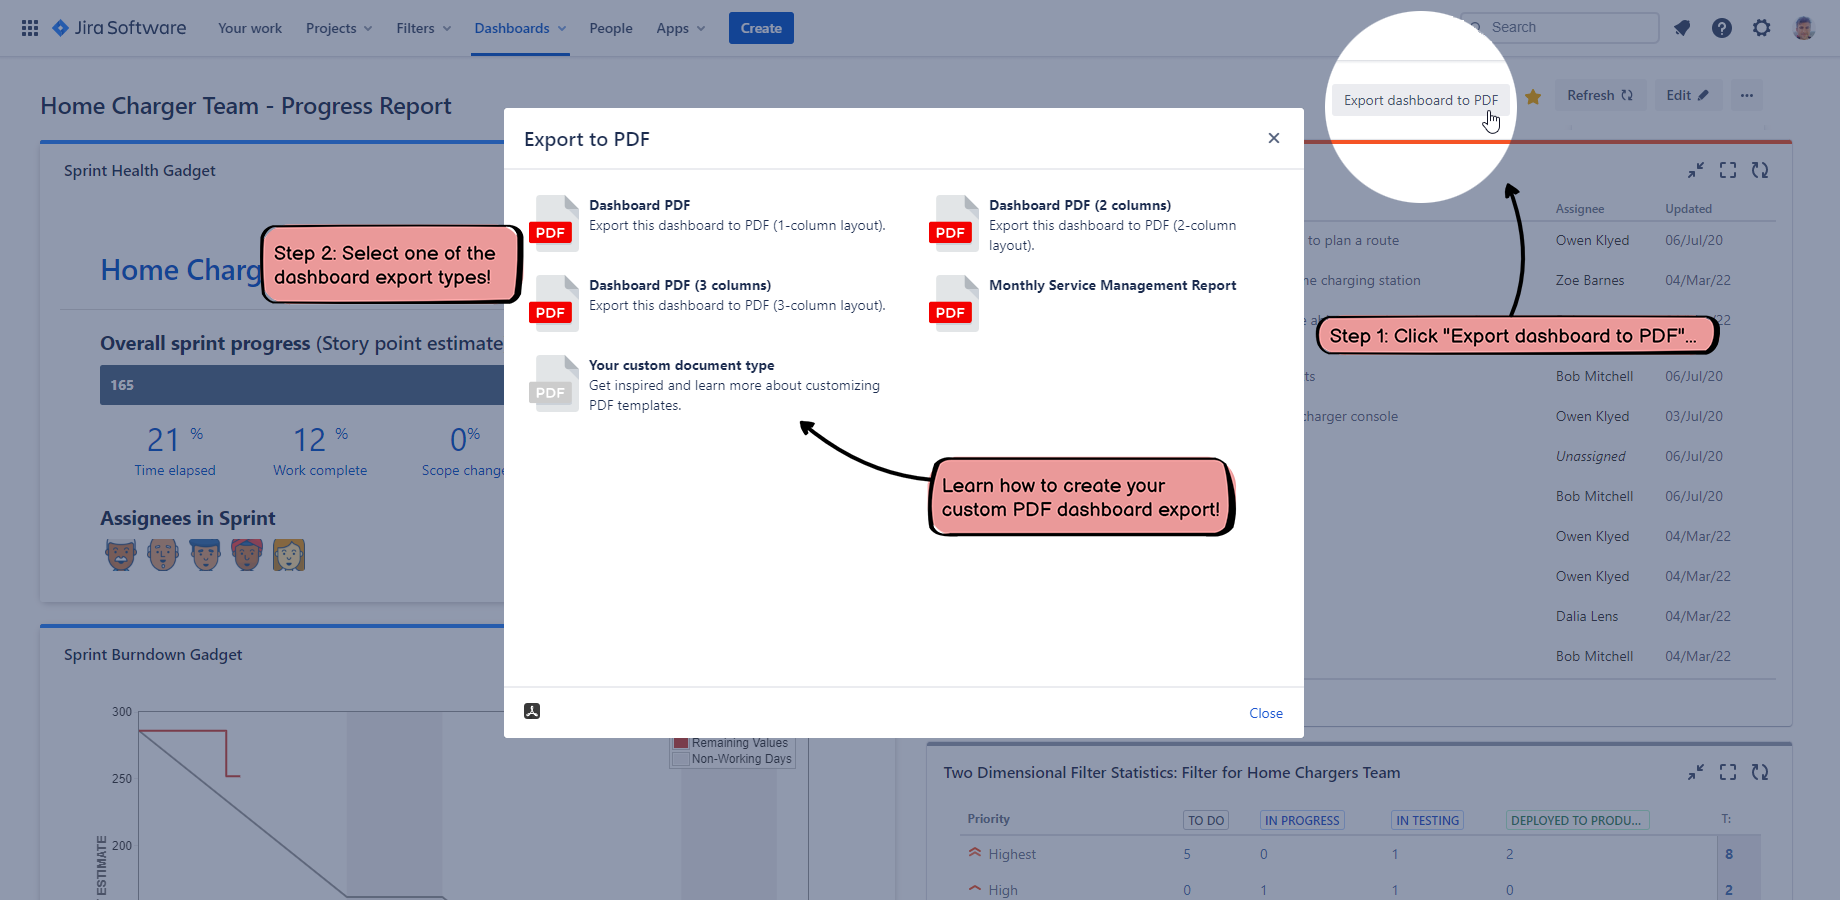
To create a PDF export immediately:
- Open the "..." menu in the top-right corner of a dashboard.
- Click "Export dashboard to PDF".
- Select the "Dashboard PDF" export type. (Or use the two alternative options to export to 2- or 3-column layouts.)
-
Enter your email address and a valid Jira API token, if the app asks for those.
- These allow the app to access the dashboard. (It is not accessible through the rather limited Jira Cloud REST API).
- Enter that email address which is linked to your Atlassian account.
- Create a Jira API token in seconds in your Atlassian account details, if you don't have one yet. (Tip: create an API token which is intuitively named "Better PDF Exporter" and which is dedicated to this app exclusively.)
- You need to enter these only once, because the app will remember them until you revoke the API token. (In other words, you can make the app forget them by revoking the API token.)
- No need to worry: these are encrypted and are stored in a super-secure storage in the Amazon AWS cloud.
- As soon as the PDF file is created, it will be automatically downloaded to your browser.
That's it!
Automatic exports
In addition to manual exports, Better PDF Exporter offers powerful automation for any type of PDF exports, also including the Jira dashboard exports.
It is possible to start automations either in regular intervals (ex: every weekday morning 8:00AM) or at certain events (ex: a new critical-priority bug is created). It is possible to automatically email the exported PDF documents, or attach those to Jira issues.
Automation rules are generally explained in the PDF automation tutorial.
For specific details about automating dashboard exports see the PDF automation for Jira dashboards section.
Another difference from manual exports is that automated exports render the PDF templates directly, not via PDF views. As there is no PDF view involved in the process, its name cannot determine the layout (number of columns) for automated dashboard exports, which is the default behavior for manual exports. It means that automated exports will use the default 1-column layout, unless you re-configure that in the dashboard-fo.vm template. You can also decide to make a copy of dashboard-fo.vm as dashboard-automations-fo.vm, use a different layout in the latter, and configure all automation actions to render this specialized version.
Supported gadgets
Better PDF Exporter supports all gadget types! The "support" can be one of two kinds: either the gadget is exported with full formatting ("full support") or with a screenshot image ("screenshot support"). When a gadget is exported with a screenshot, it can be viewed and printed, but the text content cannot be copied and the links are not working, for obvious reasons.
Our primary goal is to give "full support" for the most important gadgets which are the most probable candidates for exporting, while use the screenshot support for the less frequently used and 3rd party gadgets.
The following gadgets are supported with "full support":
- Report gadgets:
- Assigned to Me
- Filter Results
- Issue Statistics
- Issues in Progress
- Two Dimensional Filter Statistics
- Voted Issues
- Watched Issues
- Chart gadgets:
- Average Age Chart
- Average Number of Times in Status
- Average Time in Status
- Created vs Resolved Chart
- Pie Chart
- Recently Created Chart
- Resolution Time Chart
- Time Since Chart
- Jira Agile gadgets:
- Agile Wallboard
- Sprint Burndown
- Sprint Health Gadget
- Jira Service Management gadgets:
- Filter Counts
- Other gadgets:
- Activity Stream
- Introduction
- Jira Issues Calendar
- Labels
- Projects
- Quick links
- Rich Text (free HTML content)
- Starred Filters
- Wallboard Spacer Gadget
Gadgets provided by the following third-party apps are also supported with "full support":
How to ask for the full support of new gadgets?
We are more than happy to add full support for new gadget types depending on the priorities of the user community. You can ask for a new gadget type by sending a feature request to our support team. (If that gadget has already been requested, we will guide you to vote on the existing feature request.)
Customizing the dashboard exports
By default, the dashboard exports are rendered by merging the dashboard-fo.vm PDF template with gadget data.
To modify the content (e.g. hiding certain gadgets), to modify the layout (e.g. using two columns instead of one), to set image resolution for charts, you can simply modify the configuration variables in the top part of dashboard-fo.vm. To make more significant changes, like implementing a custom layout or a new document type, you have to actually edit the template. It is a good idea to copy the original dashboard-fo.vm and customize the copied template.
The following video demonstrates both (it was recorded using the Server version of the app, thus the UI is a bit different from the Cloud version):

For general template customizations, see this page, while the next section discusses the dashboard-specific customizations.
Configuring the layout (number of columns)
Depending on the dashboard, you may prefer different paper sizes and layouts:
- When you export a simple 1-column dashboard, a plain vanilla 1-column "A4 portrait" PDF is fine. (In this case, the gadgets stretch to the whole paper width.)
- When you export a regular 2-column dashboard, you probably want to get a 2-column "A4 landscape" PDF.
- When you export a complex 3-column dashboard, you probably want to get a 3-column "A3 landscape" PDF.
Important: if you have a 2-column dashboard and you export that to a 2-column PDF, your web layout will be 100% reproduced. It means that the gadgets will appear in the same columns also in the PDF. But, the strict equality of the column numbers is not required:
- If there are fewer columns in the PDF than in the web, then the "extra" web columns will be appended to the bottom of the last PDF column. (You can use this to export a 2- or 3-column dashboard to intuitive 1-column PDF pages, for example.)
- If there are more columns in the PDF than in the web, then the "extra" PDF columns will be simply left blank.
Generally speaking, you can set this variable in the top part of dashboard-fo.vm to the number of columns you wanted:
#set($columns = 1)
There is an additional logic that allows specifying the column count by the name of the PDF view that renders the template. It works like this: if the view name contains the substring "(N columns)" where N is an integer, then N will override the value of $columns and the output will appear in N-column layout:
## override the number of columns with N if view name contains "(N columns)"
#if($pdfView.name.matches(".*\(\d columns\)"))
	## ...
	## a new value parsed from the view name is assigned to "columns"
	## ...
#end
Therefore, if you want a N-column layout, you have the following options:
- Create a new PDF view with a name that contains "(N columns)".
- Rename an existing PDF view to a name that contains "(N columns)".
- If you want to specify the column count in the template, not in the view name, then assign a value to $columns in the template (and make sure that the PDF view's name does not contain "(N columns)"). If you need different column counts in different situations, create multiple copies of dashboard-fo.vm with different $columns value in each and use separate PDF views to render those templates.
Implementing custom layouts
Although using an N-column layout (as explained above) is perfect in most cases, you can also decide to implement your own custom layout. For example, in a branded report you can display your company name and logo in the top, then some full-width introductory text, then two gadgets in a 2-column section, then some full-width static text, then some other gadgets in a 3-column section, etc.
This is absolutely doable.
Practical hints:
- If you want to hardwire the gadget IDs to your template (making that a static template in some sense), then use tables and blocks to define the layout and render the gadgets by passing their IDs.
- If you want more dynamic behavior, then get the list of the gadget IDs in a dashboard with $gadget.getSortedGadgetIdsByDashboard(columns), process those if necessary, then use tables and blocks to define the layout and render each gadget where you want it.
Configuring the paper size
In the top part of dashboard-fo.vm, there is a trivial decision tree to select the "best" paper size based on the column count:
## select paper size
#if($columns == 1)
	## A4 portrait
	#set($pageWidth = "210mm")
	#set($pageHeight = "297mm")
#elseif($columns == 2)
	## A4 landscape
	#set($pageWidth = "297mm")
	#set($pageHeight = "210mm")
#else
	## A3 landscape
	#set($pageWidth = "420mm")
	#set($pageHeight = "297mm")
#end
Again, you can rewrite this to your preferences (by modifying the existing rules or adding new ones).
Configuring gadget frame colors
There is an option in the top part of dashboard-fo.vm to fill the gadget frame (top part) with the color that is configured for the web interface:
#set($useGadgetFrameColor = true)
Setting this to false will result in transparent (white) gadget headers, which make the document "more airy" (no big blocks with dark colors) and can also save ink.
Advanced customization
Despite our best efforts, some gadgets (typically third party ones) might get exported in a "half-baked" state when they're still being calculated and display a spinning circle graphics or "loading..." message. Or, they might get exported in unexpected size, typically being "too small" or "too low resolution". If these happen, the advanced configuration settings explained in this section should help.
Note that these settings affect all the dashboards and all the gadgets you are exporting. If you need custom setting only for certain dashboards, copy of dashboard-fo.vm with an intuitive name like dashboard-hi-resolution-fo.vm, configure higher resolution in the copy, and create a new view "Dashboard (Hi resolution)" which renders the copy. Your users will be able to choose the optimal PDF view for each dashboard export.
Configuring dashboard wait time
If a gadget loads slowly, our renderer engine might capture it before the gadget has a chance to display its final content. In the PDF document, these gadgets will be shown in some sort of "loading" state.
To fix this, you can simply increase the wait time from the default 1 second up to 30 seconds. The renderer engine will wait longer, giving more chance to the gadget to finalize itself.
When to use it? Use it when a gadget loads noticeably slowly in your browser and the export comes out with an incomplete gadget. As this is basically a timing issue, it can happen that sometimes the gadget is exported correctly and other times it is not.
How to use it? Just comment out this line in dashboard-fo.vm:
#set($gadget = $apiClientFactory.createGadgetClient($columns))
Then uncomment the following line:
#set($gadget = $apiClientFactory.gadgetClientBuilder($columns).withWaitTimeForPageLoad(6).build())
"6" in the code above means "6 seconds" wait time. Finding out the optimal wait time requires some testing. We suggest increasing the wait time gradually until all gadgets are exported correctly. To eliminate the "random timing", test the export multiple times. (Of course, setting this to the maximum 30 seconds could solve the problem immediately, but it would make all your dashboard exports unnecessary long.)
If you see an error, then possibly you have set the parameter too high or you have too many gadgets on your dashboard (there is a technical hard limit on the export time per dashboard).
Configuring gadget screenshot resolution
When you export an unusually wide gadget (e.g. a wide table with many columns), its content might not perfectly fit into the screenshot created by the renderer engine using the default width. The resulted image will be cramped, the columns being too narrow or the right side of the gadget will be cropped.
To fix this, you can configure the width of the screenshots so the whole gadgets will fit in. For that, just comment out this line in dashboard-fo.vm:
#set($gadget = $apiClientFactory.createGadgetClient($columns))
Then uncomment the following line:
#set($gadget = $apiClientFactory.gadgetClientBuilder($columns).withBrowserWidth(3000).build())
"3000" in the code above means "3000 pixels" width. Finding out the optimal width requires some testing.
In addition to width, you can also set the height of the screenshot. Most of the time it is unnecessary: height does not affect the layout of the content as it is not restricted vertically by the browser.
If you still need it, here is an example:
#set($gadget = $apiClientFactory.gadgetClientBuilder($columns).withBrowserWidth(3000).withBrowserHeight(4000).build())
Note that configuring the screenshot dimensions will affect the appearance of all gadgets that are exported using the screenshot-based approach. A value too high will result in smaller letters and reduced legibility.
Working with gadgets in the PDF templates
Your primary helper in the templates is the Velocity tool called $gadget. You can obtain it like this:
#set($gadget = $apiClientFactory.createGadgetClient())
It provides the following easy-to-use API:
| Code | What does it do? |
|---|---|
| $gadget.getDashboardInfo() | Returns the details of the current dashboard:
#set($dashboardInfo = $gadget.getDashboardInfo()) $dashboardInfo.id ## identifier $dashboardInfo.title ## title $dashboardInfo.layout ## layout type (A, AA, AB, etc.) |
| $gadget.getGadgetIds() |
Returns the list of all gadget IDs in the current dashboard. It is returned in "visual" order (top to bottom within column, left to right among columns). |
| $gadget.getSortedGadgetIds(2) |
Returns a "2D collection" of the gadget IDs in the current dashboard, laid out for a 2-column layout. In the return value, the outer list contains the columns (left to right), while inner lists contain the gadget IDs within the column (top to bottom). The layout algorithm in the PDF follows the web layout of the dashboard as much as possible. If the PDF has equal or more columns than the web, then the web layout is 100% reproduced in the PDF. If the PDF has less columns than the web, then all "additional" web columns will inserted to the bottom part of the last PDF column. |
| $gadget.getGadgetInfo(10200) | Returns the details of the gadget with the ID = 10200:
#set($gadgetInfo = $gadget.getGadgetInfo(10200)) $gadgetInfo.id ## identifier $gadgetInfo.title ## title $gadgetInfo.color ## gadget titlebar color code |
| $gadget.getCompleteTitle(10200) |
Returns the complete title of the gadget with the ID = 10200. It contains the gadget name plus the configured project- or filter name. |
| $gadget.getSvgCharts(10200) |
Returns the list of SVG charts (plus their metadata) of the gadget with the ID = 10200. You can access the raw SVG document with the $gadgetSvgChart.document expression. |
| $gadget.calculateSvgWidth($svgChart, "210mm", 3) |
Calculates the ideal width of an SVG chart for 21cm page width and for 3-column layout. You can obtain the SVG chart object with the previous API call. |
| $gadget.getContentHtml(10200) |
Returns the HTML content of the gadget with the ID = 10200. This contains the chart image (if there is), the issue list, two-dimensional analytics, summary line (for charts), etc. depending on the type of gadget. It can be transformed to FO like: <fo:block> $pdfRenderer.htmlToFo($gadget.getContentHtml($gadgetId)) </fo:block> |
Selecting the dashboards and gadgets to export
Using the $gadget tool you can solve the most typical exporting requirements with the following control logics:
- Exporting a single gadget: find the gadget ID and export the gadget.
- Exporting multiple gadgets: find all gadget IDs, iterate over the gadgets and export the current one.
When we say "export", we mean using the following macro that is available in dashboard-fo.vm:
## macro to render a gadget
#macro(gadgetBlock $gadgetId)
	## ...
#end

## usage
#gadgetBlock(10200)
You will be able to create any sort of custom dashboard export based on this guidance. For instance: under your company logo you can display gadgets in a 2-column layout with both the chart image and the related data table.
Please study the default dashboard-fo.vm template for a full, working example and make sure you read the template development guide.
How can I find out the ID of a gadget?
If you are curious about the ID of a gadget, right click on its title bar in the browser and select Inspect in the drop-down menu. You will see the numeric gadget ID in the document model tree, like 10038 in this sample:
<h3 id="gadget-10038-title" class="dashboard-item-title" title="Version Report">Version Report</h3>
Questions?
Ask us any time.