
In this page
eazyBI integration features
eazyBI PDF export samples
Agile insights and metrics export
Business performance export
Service excellence dashboard export
Configuration
Troubleshooting
Learn more about eazyBI
What is eazyBI?
(supported since Better PDF Exporter 4.7.0)
The eazyBI Reports and Charts for Jira app is a powerful business intelligence tool that enables users to create advanced reports, dashboards, and charts based on Jira data.
eazyBI integration features
- You can export the eazyBI dashboard and eazyBI report gadgets to PDF.
- Currently the gadgets are exported as screenshots. If you are interested in the full support, please vote and comment on this related feature request.
(Need more features? Tell us in a support ticket!)
eazyBI PDF export samples
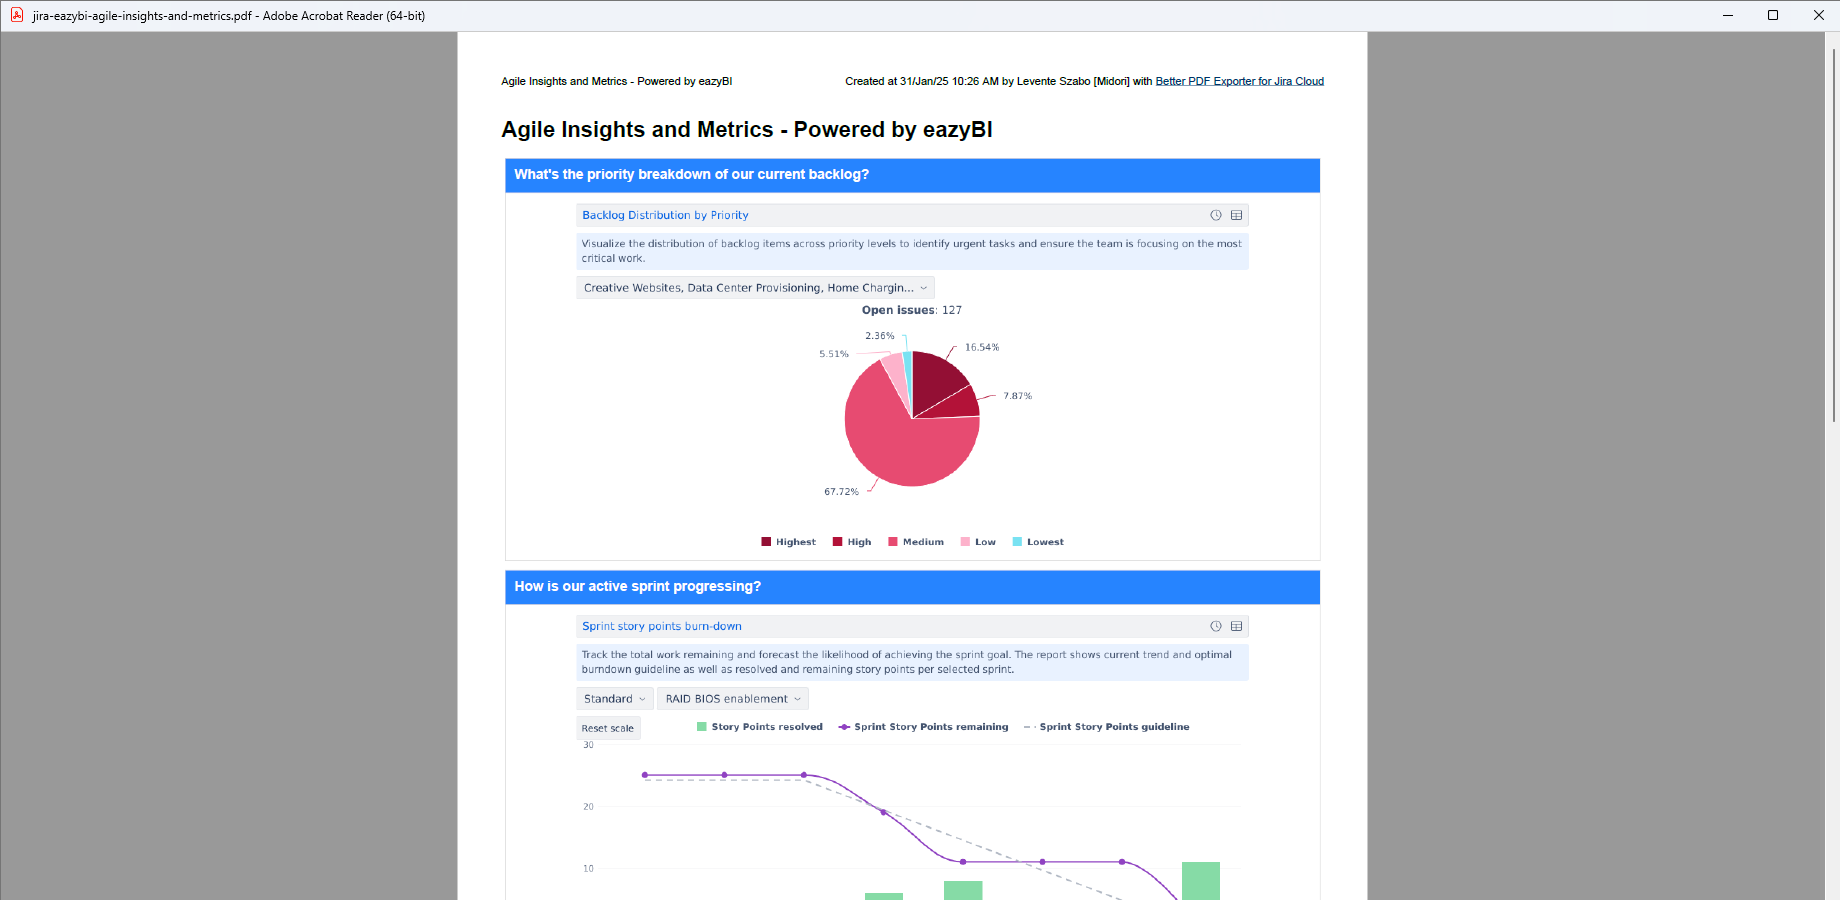
Agile insights and metrics export
Agile project report that visualizes key metrics such as backlog priorities, sprint progress, task completion time, and epic-level story point velocity.
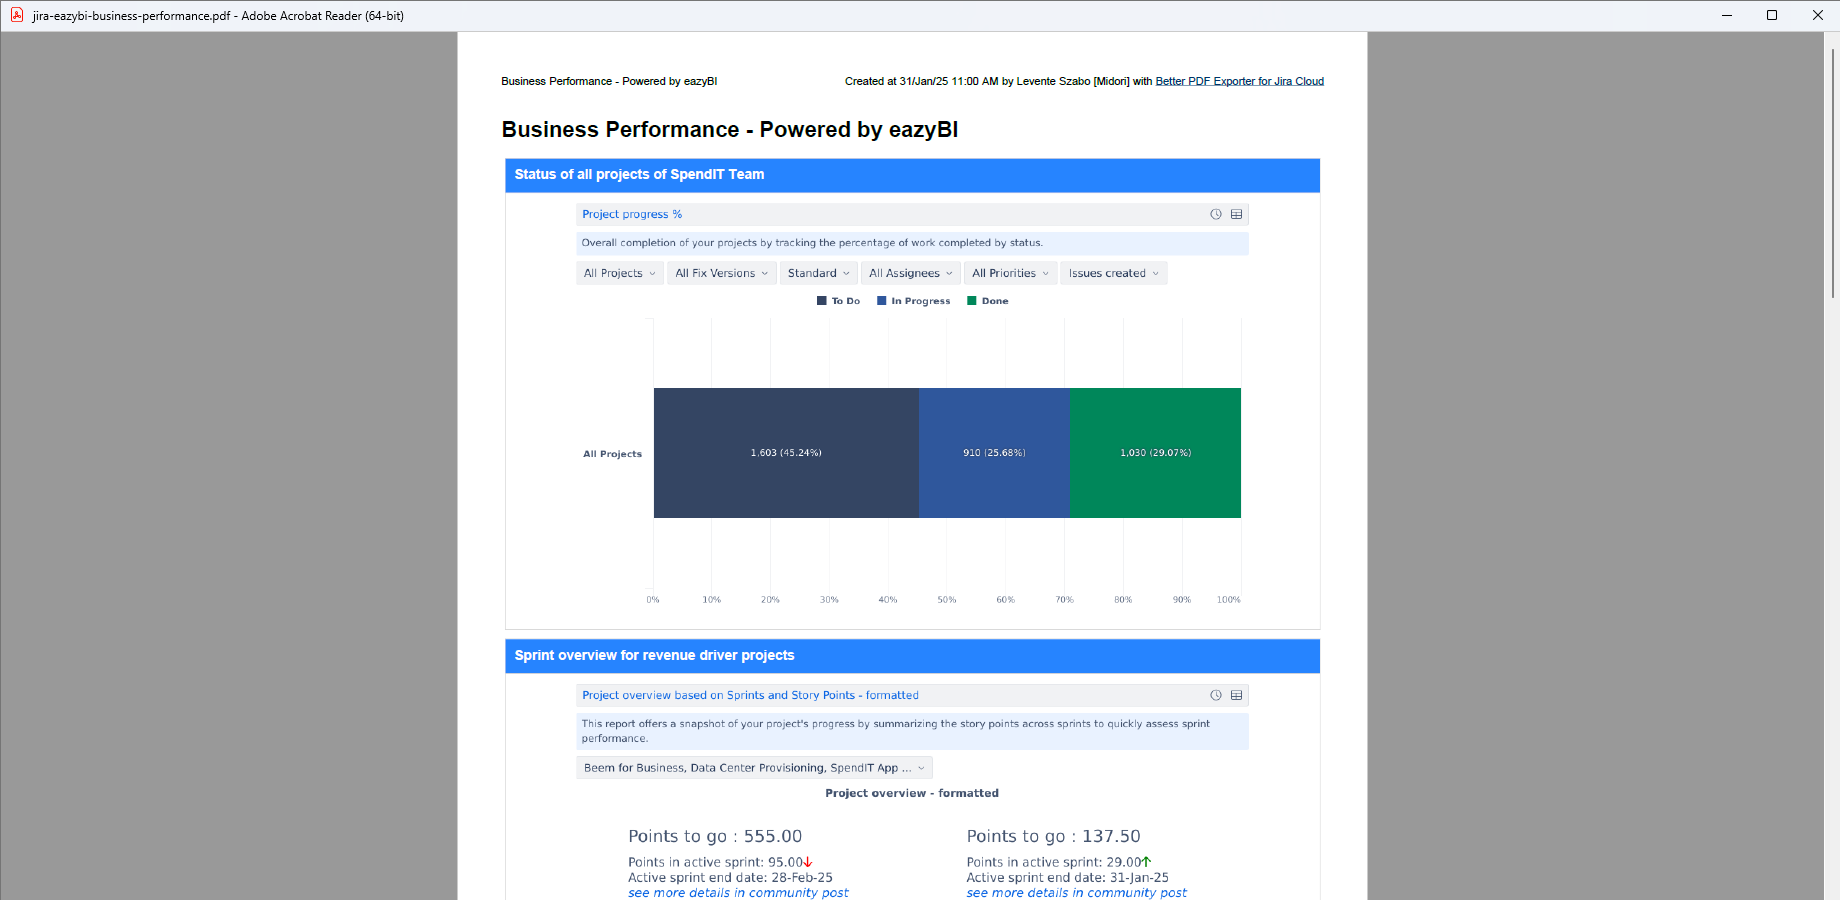
Business performance export
Business performance dashboard, highlighting key insights such as project status, sprint progress, workload distribution, issue resolution speed, and risk levels across teams.
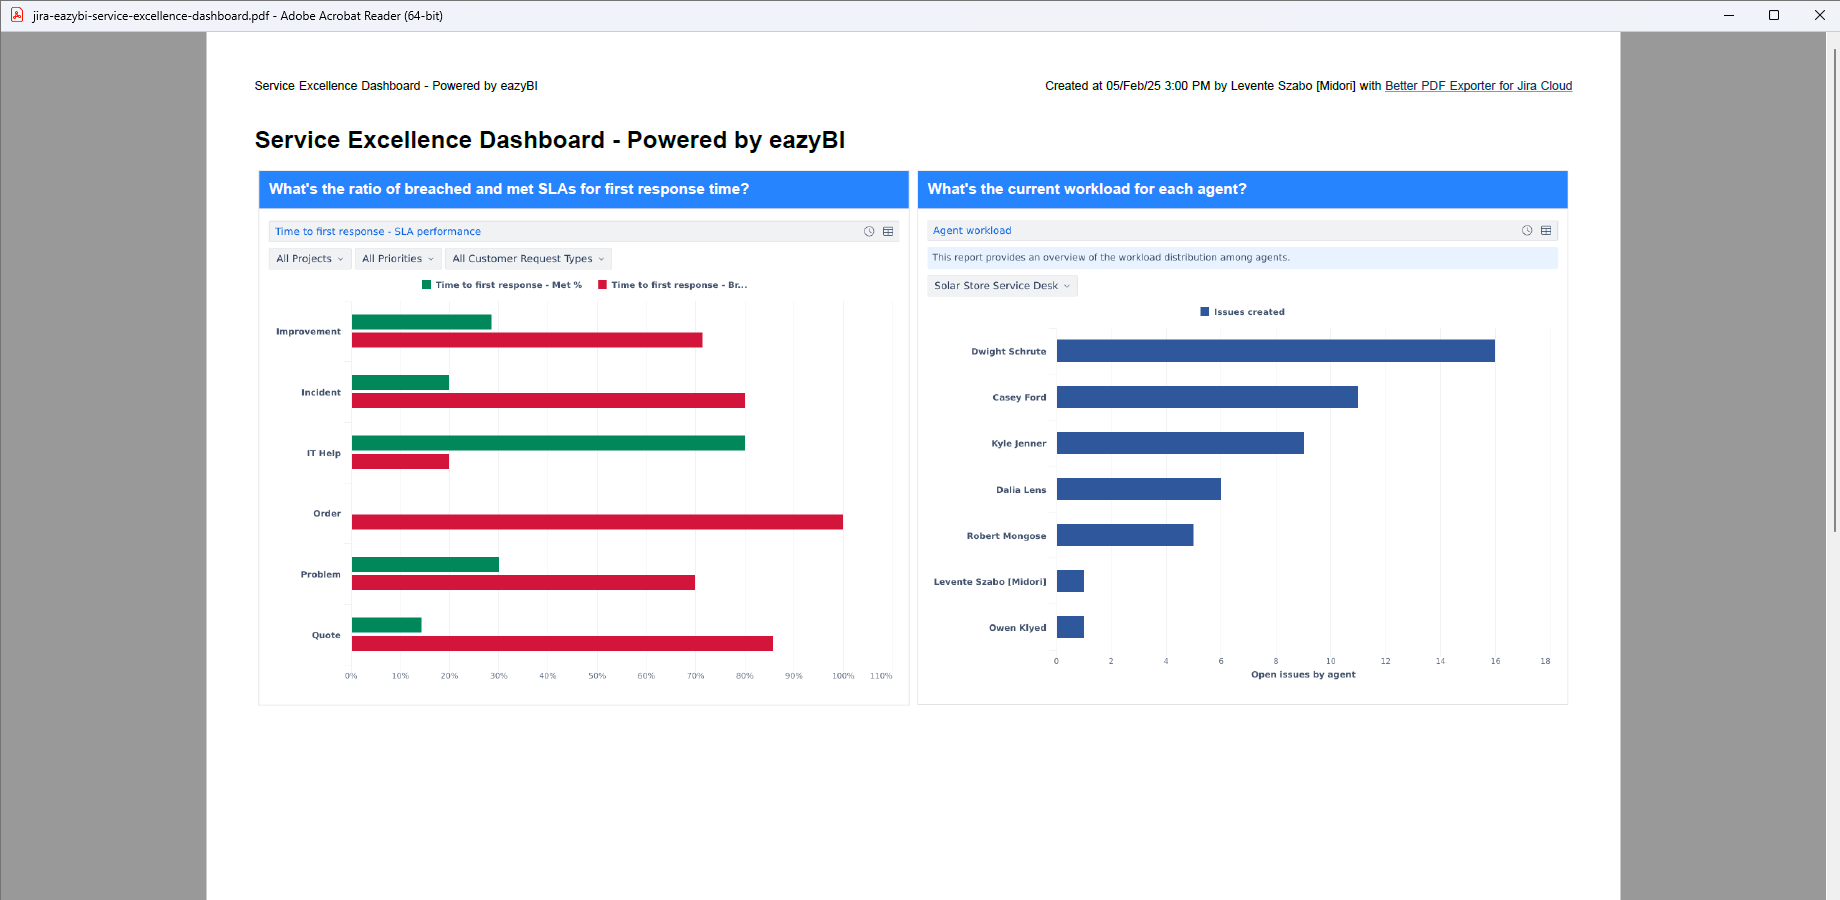
Service excellence dashboard export
Service excellence dashboard that provides a detailed view of SLA compliance, agent workload, ticket escalations, and service request volumes to support high-quality customer service performance.
Configuration
See the generic dashboard customization guide.
Troubleshooting
See the dashboards-related section in the troubleshooting page.
Learn more about eazyBI
- eazyBI product information (at its own vendor)
- eazyBI documentation
- eazyBI app page (on the Atlassian Marketplace)