
Export eazyBI gadgets from Jira
eazyBI Reports and Charts for Jira is an advanced reporting and data analysis app that allows users to create custom reports, charts, and dashboards from Jira data and external sources. With a flexible drag-and-drop report builder, it supports pivot tables, trend analysis, and complex calculations, empowering teams to gain deep insights into their projects. It’s ideal for data-driven teams seeking powerful visualization and business intelligence capabilities within Jira.
Next steps
- For the tutorial video and the configuration guide, see the eazyBI integration page.
- Create similar PDF reports from your own issues with the free 30-day trial!
Export samples
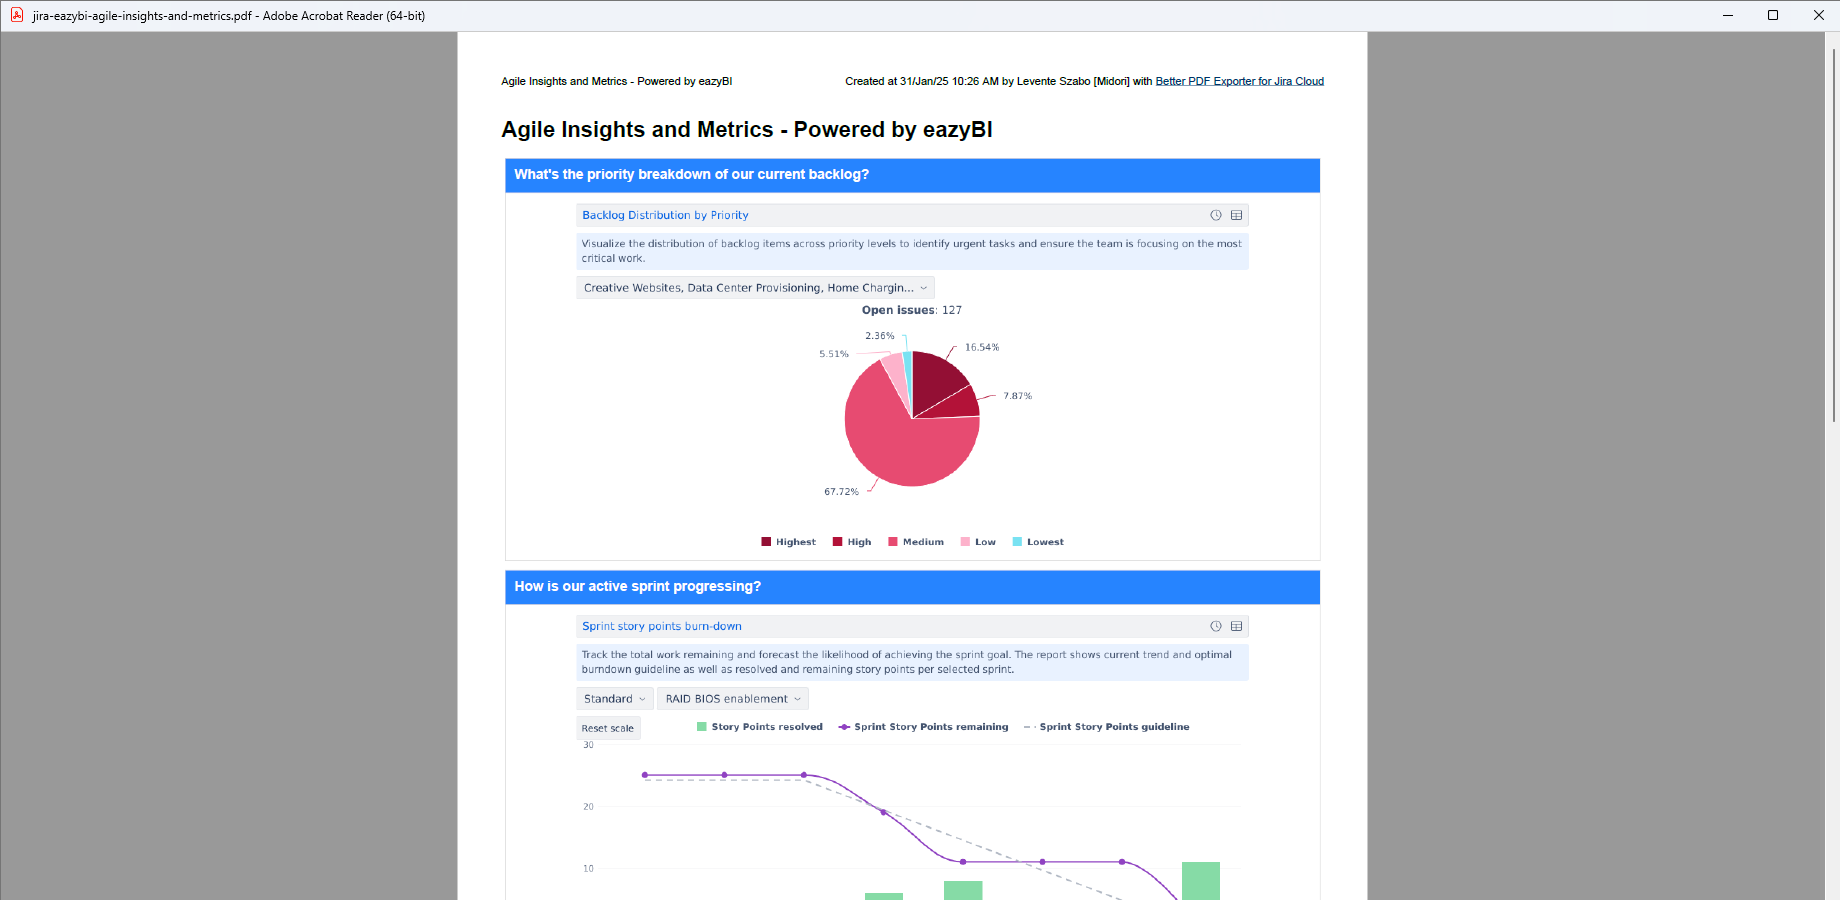
Agile insights and metrics export
Agile project report that visualizes key metrics such as backlog priorities, sprint progress, task completion time, and epic-level story point velocity.
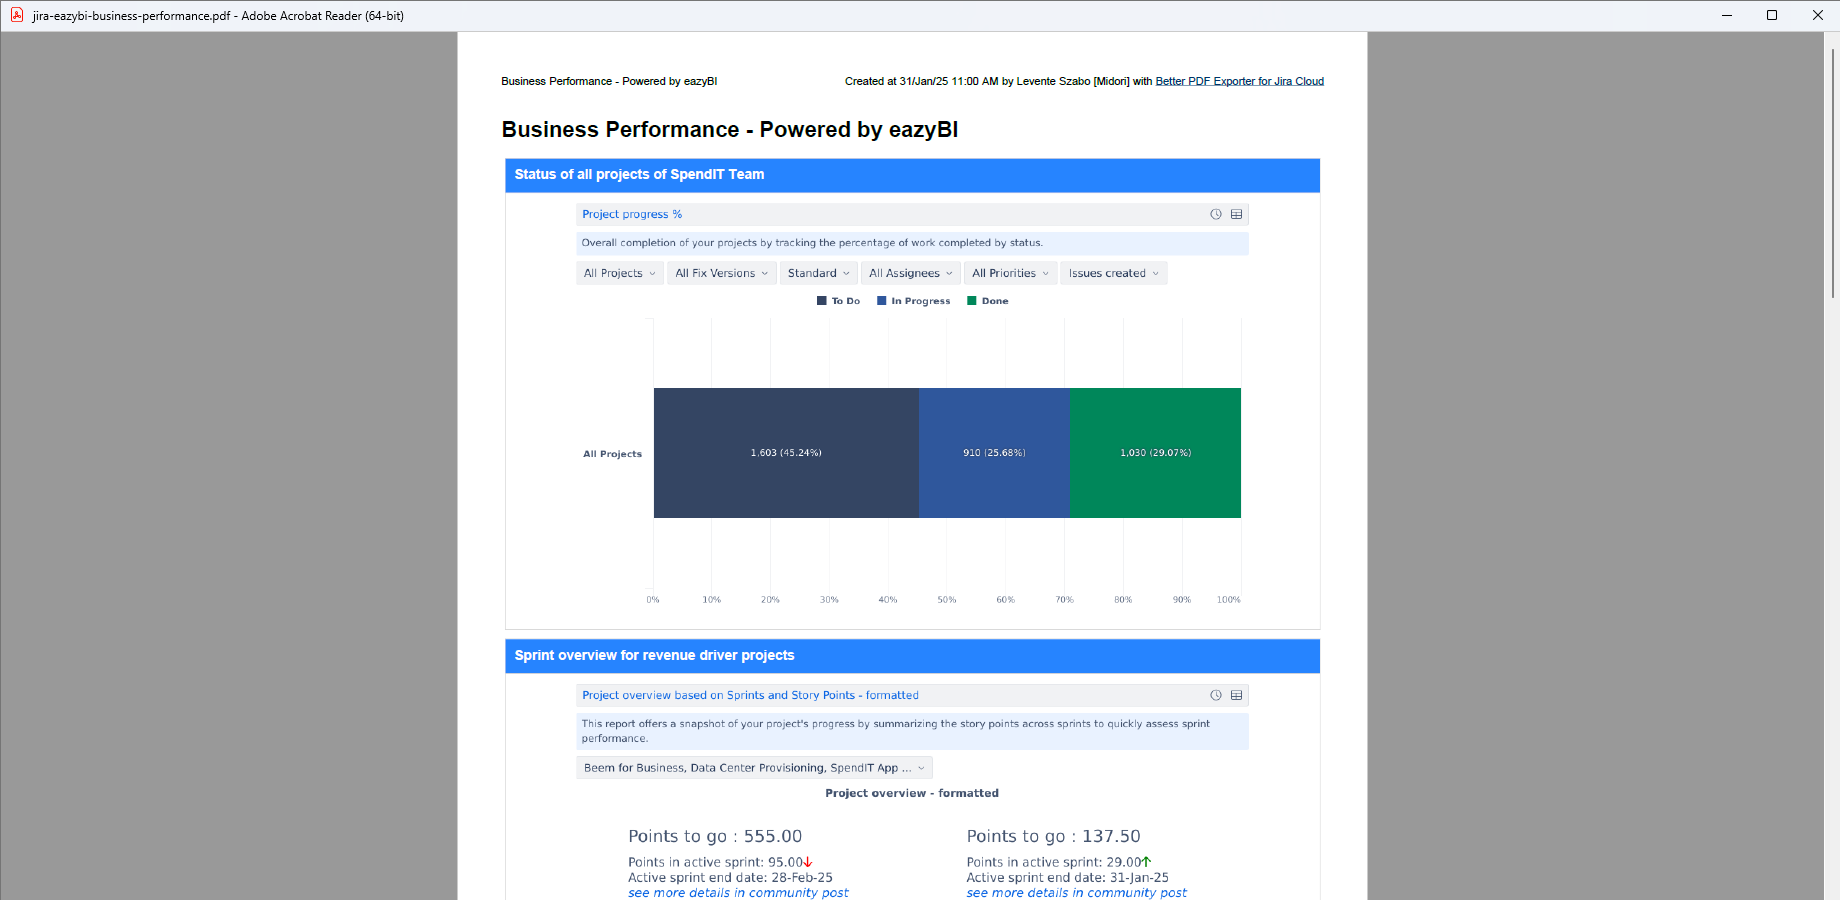
Business performance export
Business performance dashboard, highlighting key insights such as project status, sprint progress, workload distribution, issue resolution speed, and risk levels across teams.
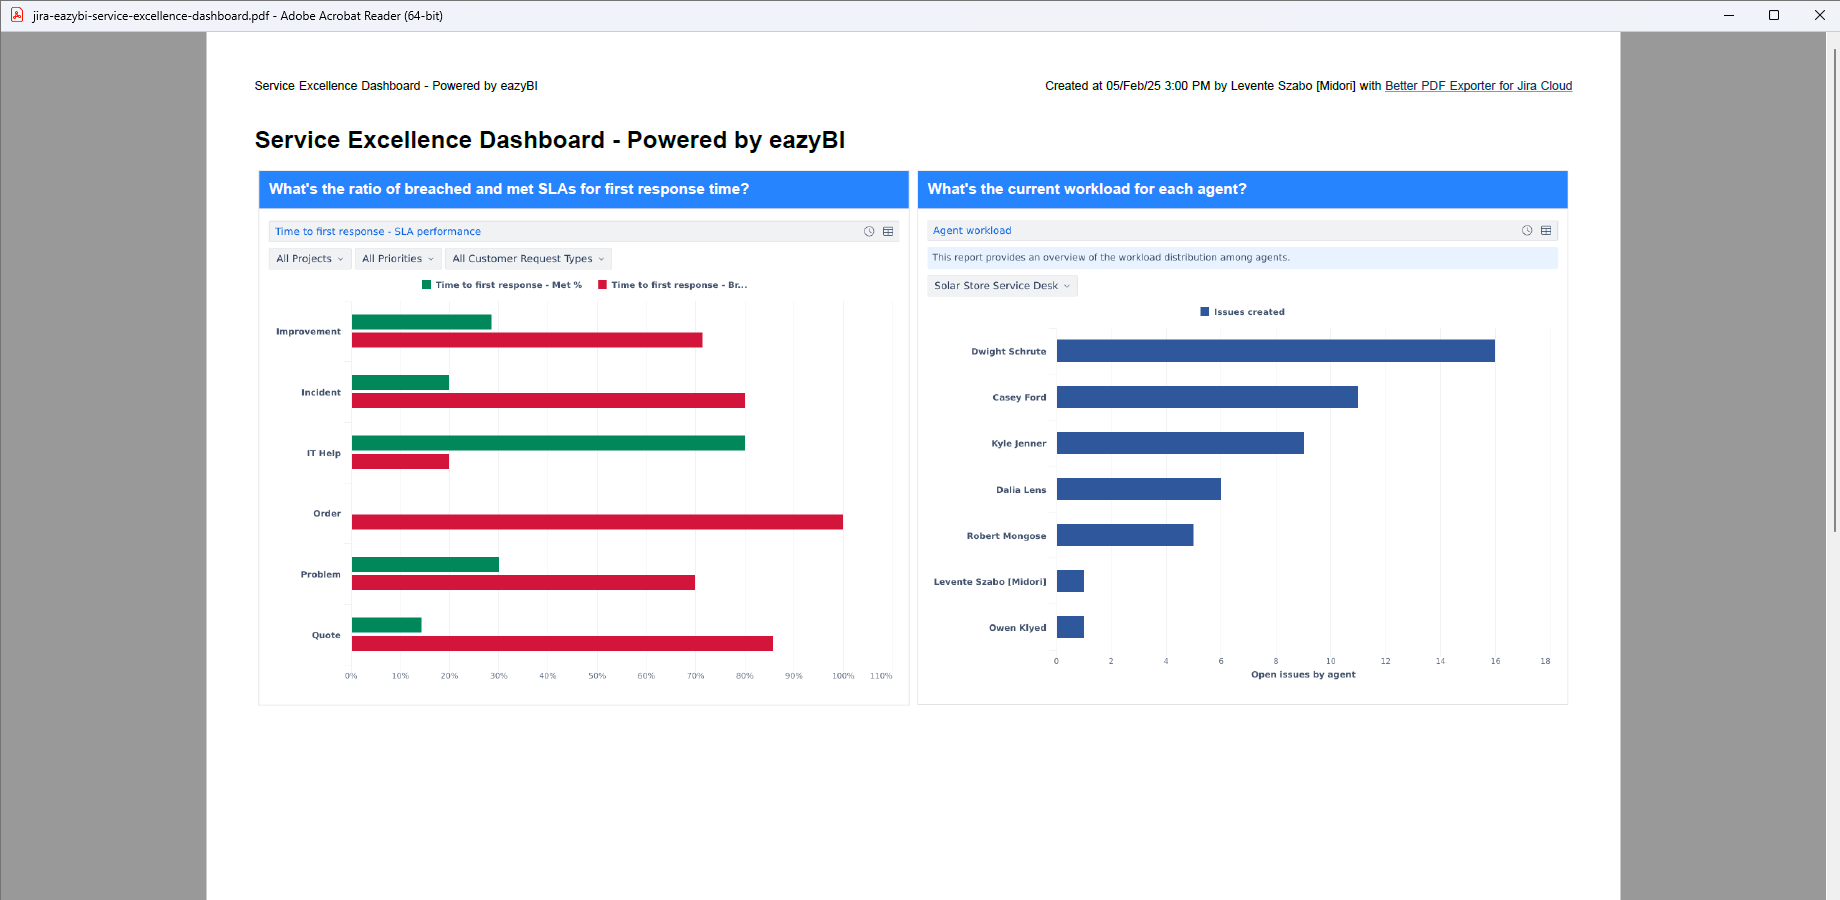
Service excellence dashboard export
Service excellence dashboard that provides a detailed view of SLA compliance, agent workload, ticket escalations, and service request volumes to support high-quality customer service performance.