
In this page
Exporting Jira dashboards to PDF
Benefits of sharing Jira dashboards
Tutorial video
Exporting Jira reports to PDF (via gadgets)
Exporting Jira Software boards to PDF (via gadgets)
Dashboard export samples
Basic Jira dashboard PDF export
Monthly Jira Service Management report
Aggregated Jira Scrum sprint report
Kanban performance report
Jira reports and agile boards
Automatic localization for dashboards & reports
Learn more about Jira dashboards
How to export Jira dashboards to PDF?
Manual exports
Automatic exports
Supported gadgets
Replacing unsupported gadgets with supported ones
How are unsupported gadgets exported?
How to ask for the support of new gadgets?
Customizing the dashboard exports
Configuring the layout (number of columns)
Implementing custom layouts
Configuring the paper size
Configuring gadget frame colors
Displaying the data tables for charts
Working with gadgets in the PDF templates
Selecting the dashboards and gadgets to export
How can I find out the ID of a dashboard?
How can I find out the ID of a gadget?
Overview
Exporting Jira dashboards to PDF
Jira dashboards are great tools to summarize information in a single screen composed of gadgets, compact configurable boxes which present one specific type of information. A gadget can contain a list of issues, a graphical chart, an activity stream, or some other type of key data in a quick-to-understand format.
Dashboards are, however, not suitable for sharing with others outside the Jira web interface:
- They cannot be exported to document files (like Word or PDF).
- They are difficult to print in good quality (browsers have difficulties with layouting the dashboard page to printed pages).
- Exporting them to image files has numerous drawbacks: texts cannot be copied from the image, links are not clickable in the image, etc.
This article describes a powerful method to export Jira dashboards to PDF documents using the Better PDF Exporter app.
The resulted PDF files can be shared, emailed, archived, printed, or even further edited, just like any other electronic business document. They are also highly customizable: not only you can show or hide certain gadgets, add your company branding (logo and colors), or change the layout, you can also mix Jira gadgets with any other type of information within the same PDF.
Benefits of sharing Jira dashboards
Here are some examples, how dashboard exports will improve the efficiency of your team:
- Share Jira reports with your customers without giving them access to your Jira and the web-based dashboards.
- Automatically send a weekly summary report to your executives every Monday morning.
- Automatically save a dashboard every night to a long-time storage in order to track the evolution of information.
Tutorial video
Watch the following video to get started quickly:
Exporting Jira reports to PDF (via gadgets)
You can also export Jira reports to PDF by exporting Jira dashboards.
How? Most of the Jira reports have their equivalent gadgets. For example, the Created vs Resolved Issues Report shows you the trend of issue creations and resolutions in a graphical chart and an additional data table. You can get the same result with a similarly configured Created vs. Resolved Gadget added to a dashboard. Then, you can export the dashboard to PDF, and now you have the Jira report in a customizable, shareable, printable form! (Note: by default, these gadgets will be exported as chart-only, but you can enable the export of the data table, too.)
Even better, if you add multiple gadgets to the same dashboard, you can combine multiple reports to the same PDF:
Exporting Jira Software boards to PDF (via gadgets)
Similarly to reports, you can also export Jira Software boards (including Scrum, Kanban, Kanplan ones) to PDF by exporting Jira dashboards.
Just add the Wallboard Gadget to a dashboard, then export the dashboard to PDF:
Dashboard export samples
The following PDF reports should give you an idea about the possibilities:
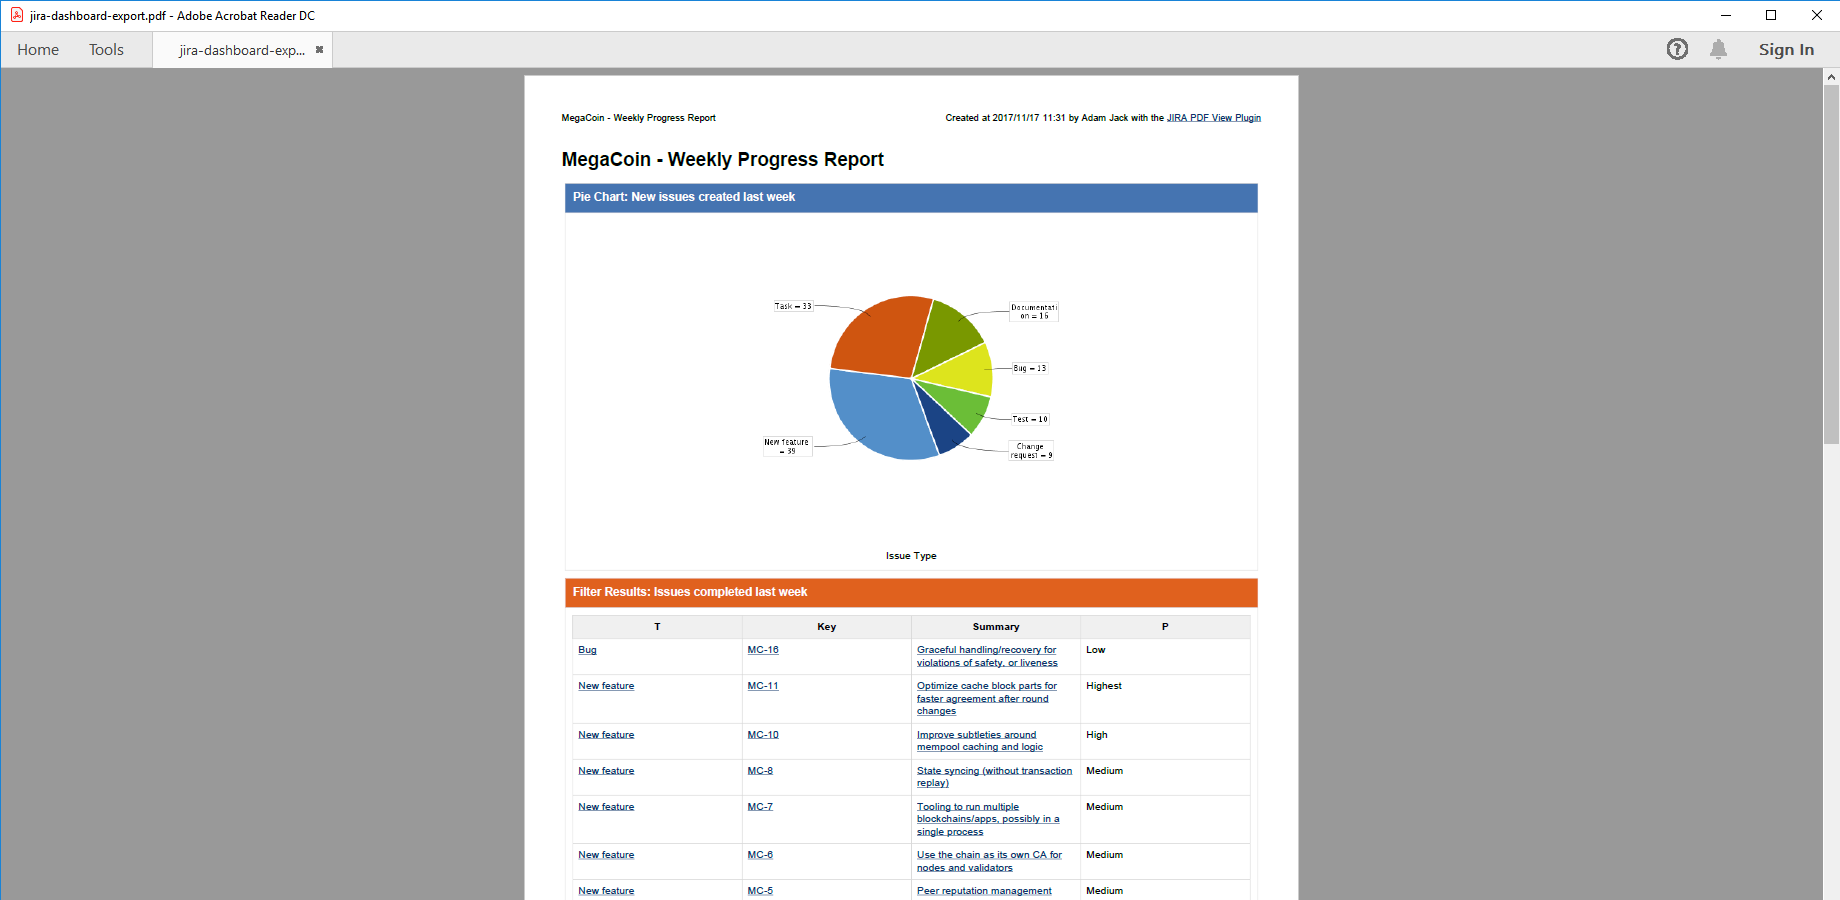
Basic Jira dashboard PDF export
One-column, portrait oriented export of a progress tracking dashboard, featuring the Created vs. Resolved, the Two Dimensional Filter Statistics, the Issue Statistics, the Pie Chart and the Filter Results gadgets. You should expect this look using the default settings in the template.
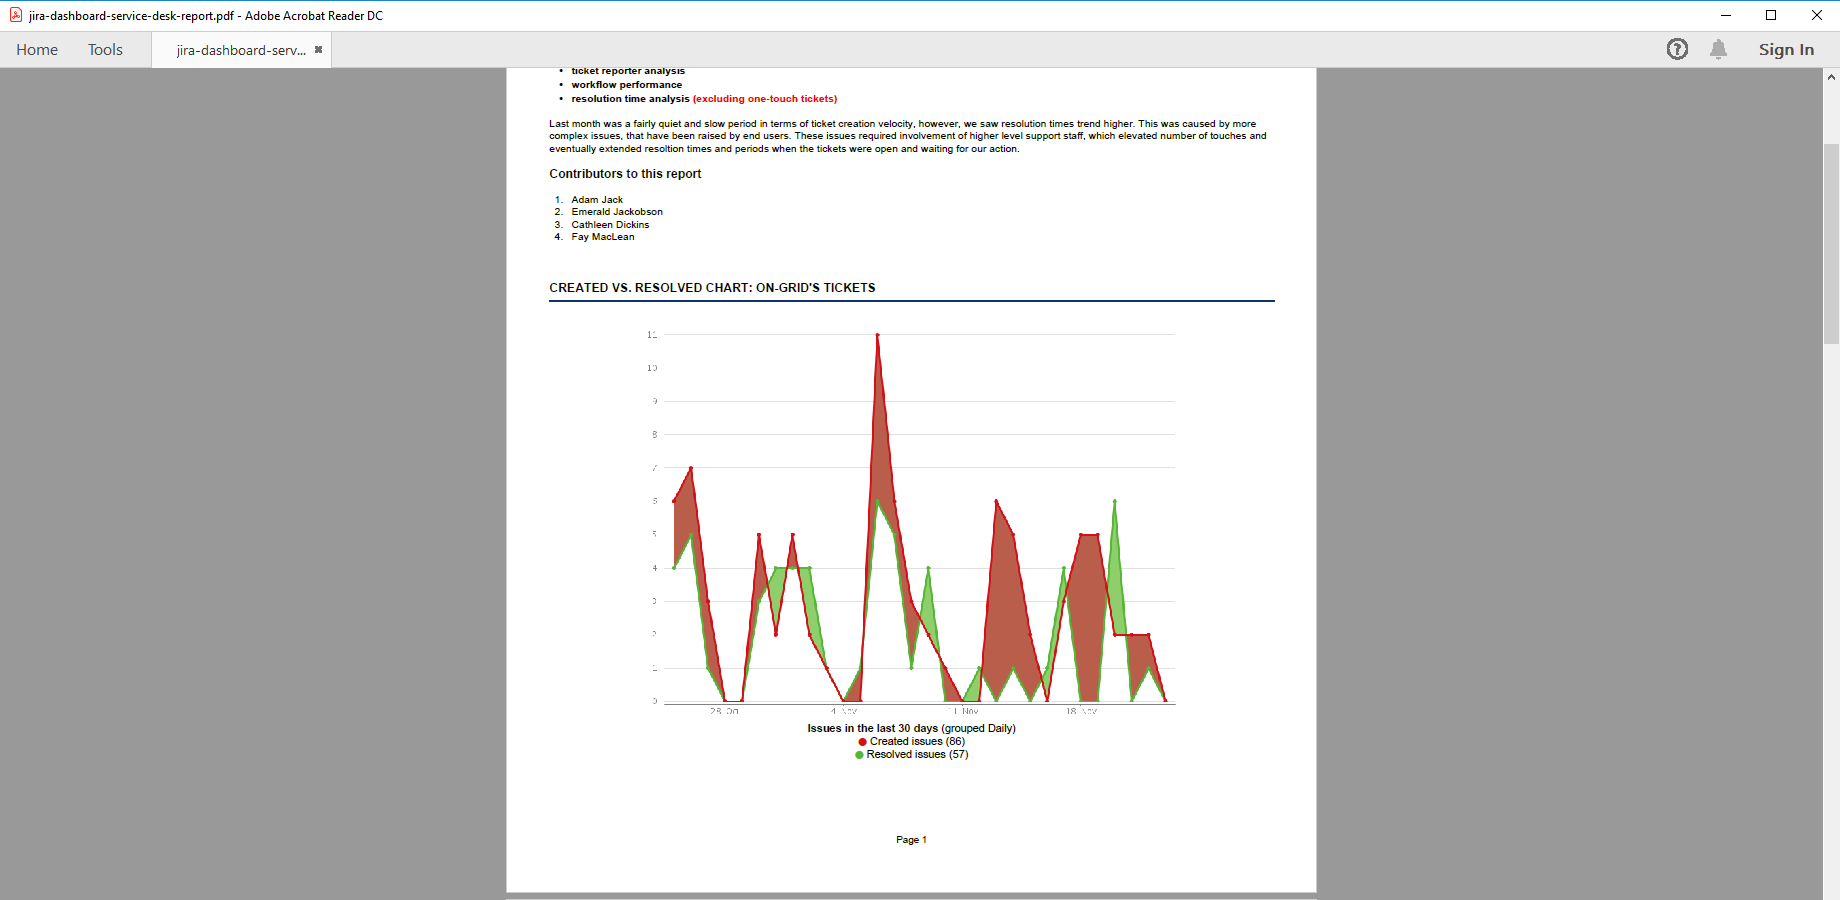
Monthly Jira Service Management report
This company-branded PDF document is combining hand-written content with the visually simplified look of the Average Age Chart, the Time to First Response Chart, the Recently Created Chart, the Resolution Time and the Average Time in Status gadgets (plus others). It is, essentially, a customer-facing PDF dashboard export of Jira-sourced key performance indicators (KPIs).
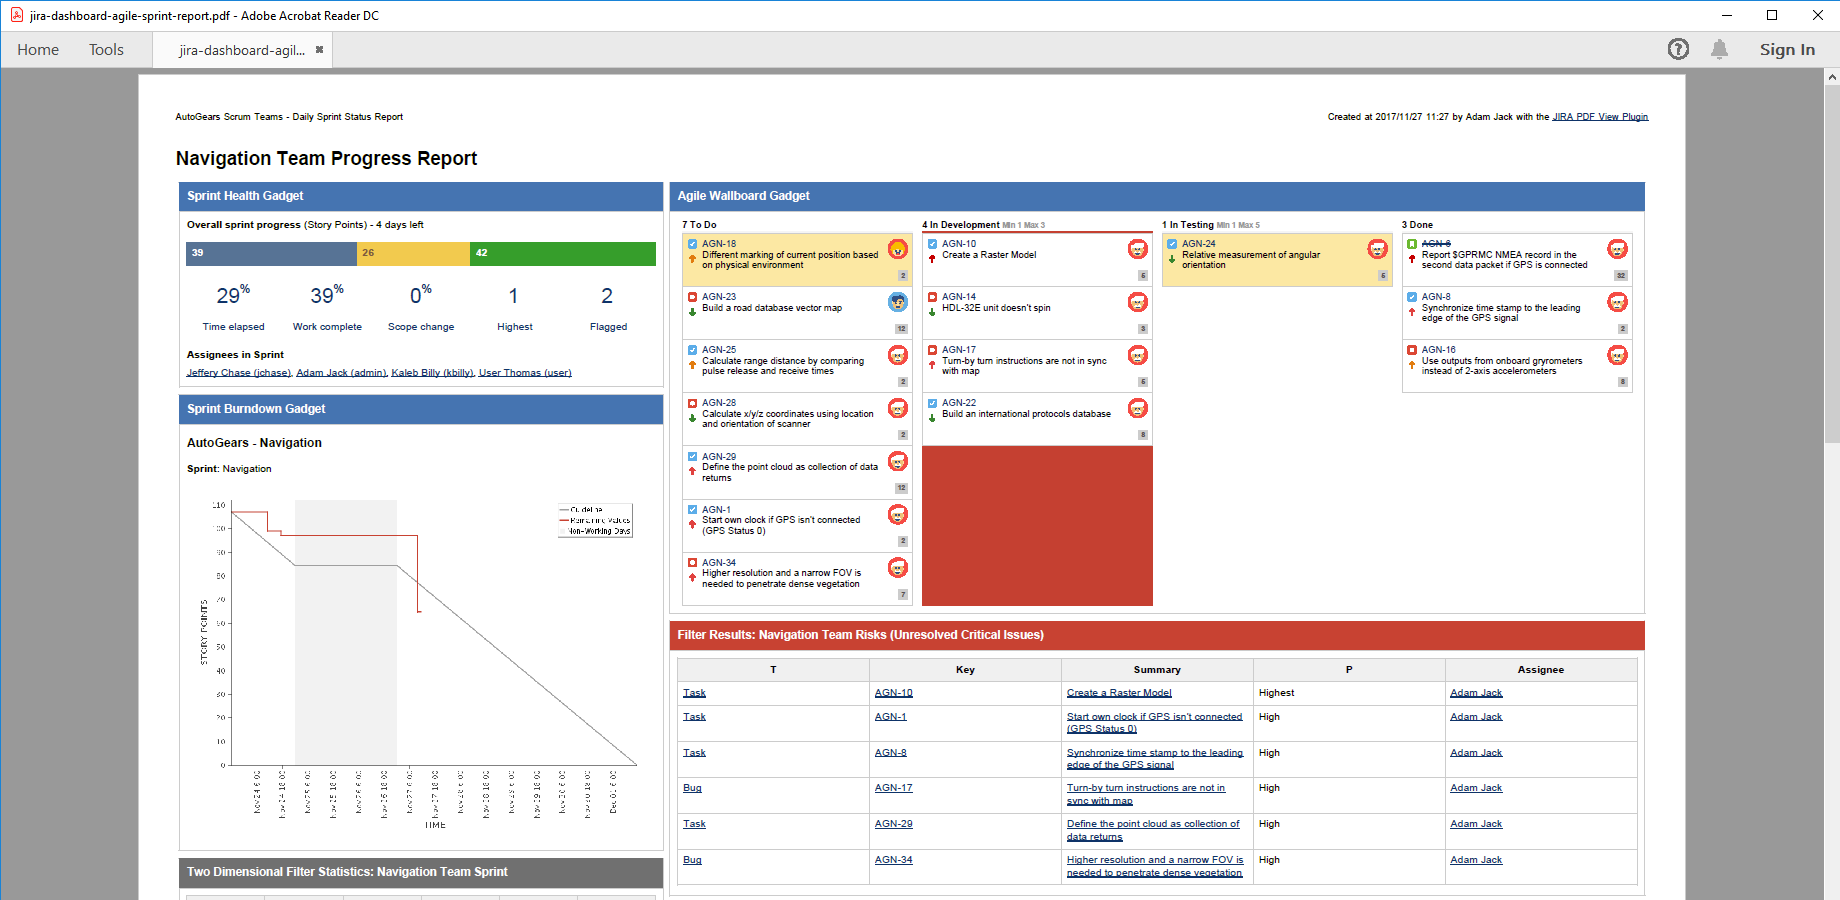
Aggregated Jira Scrum sprint report
This PDF export example aggregates the status reports of 3 teams' on-going sprints into a single PDF document, one page per team. In addition to Jira Core gadgets, it also contains the following Jira Software gadgets: Sprint Health, Sprint Burndown and Agile Wallboard. This is a great data source for cross-team status reviews and daily stand-ups.
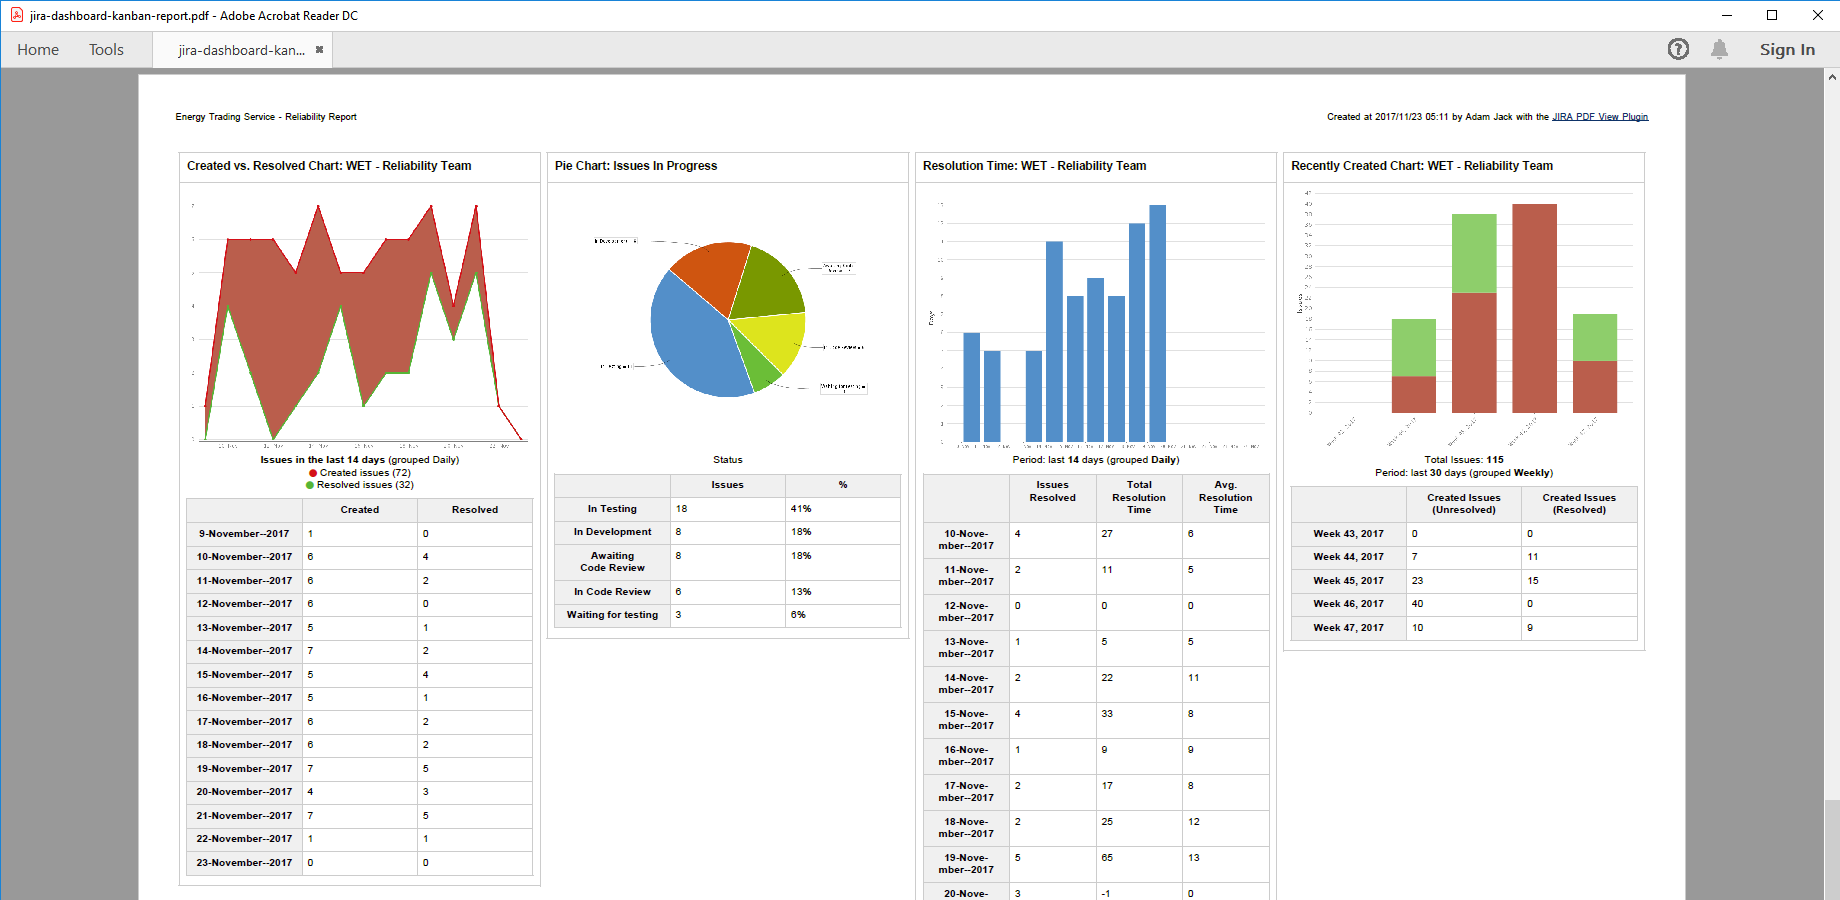
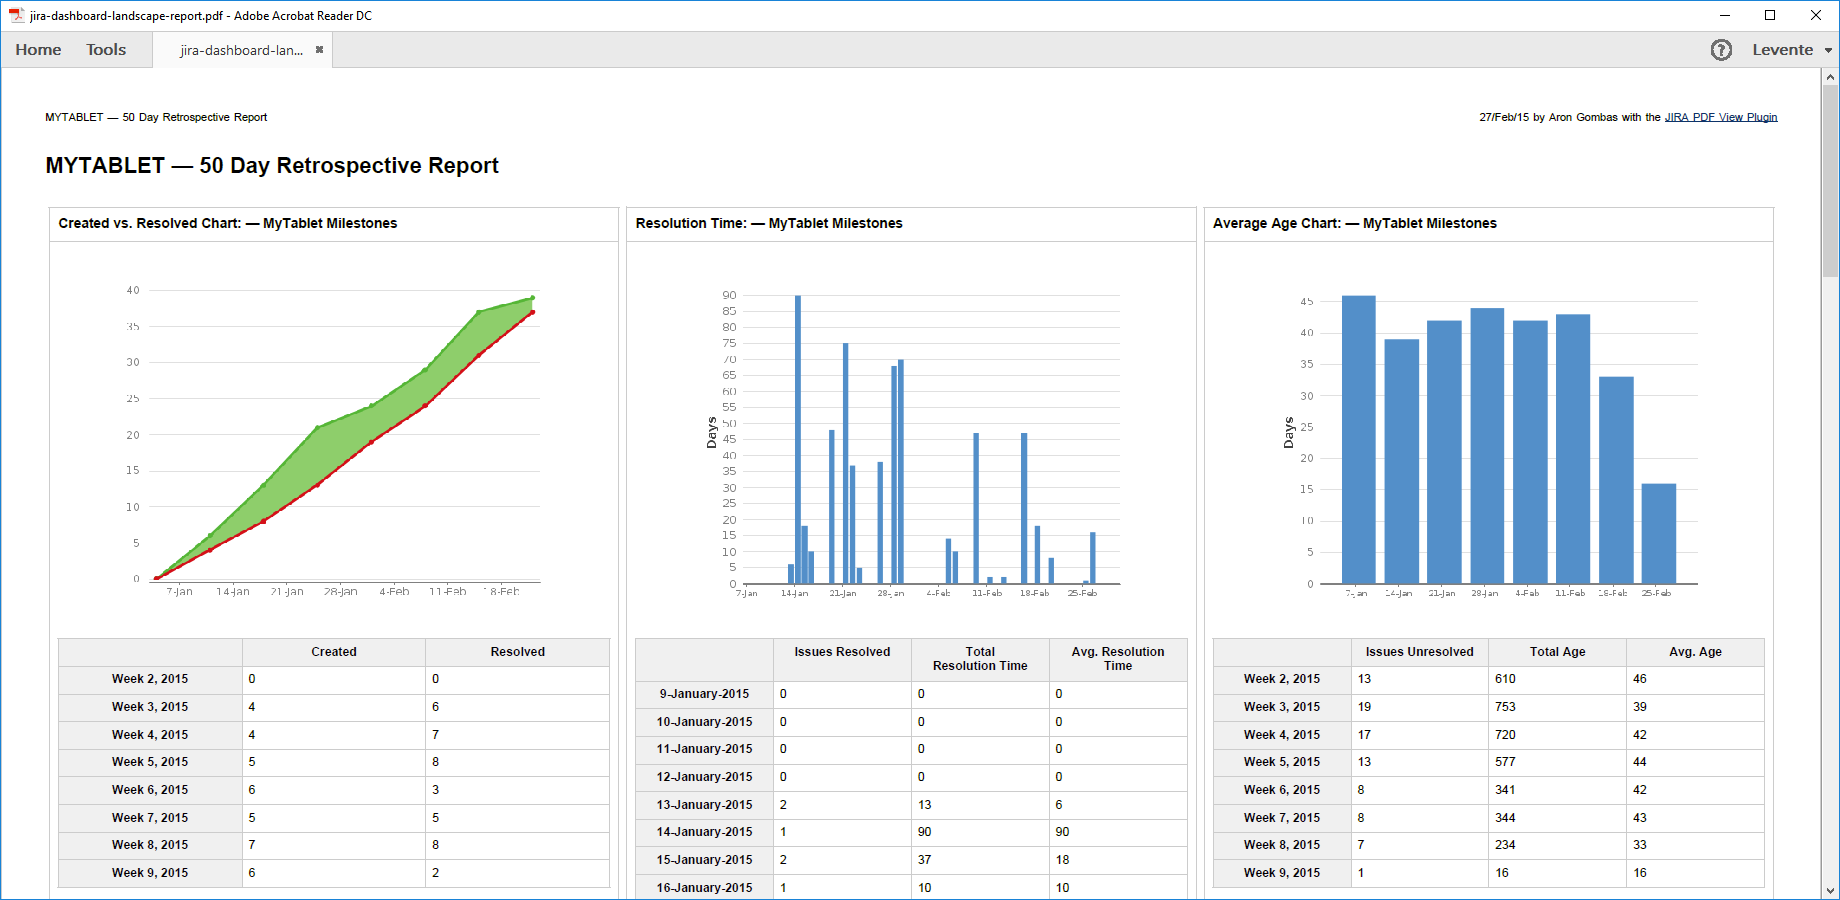
Kanban performance report
This A3 landscape PDF example demonstrates using custom layouts for Jira dashboard exports: a Kanban board is stretching to the full page width in the top, followed by four charts and their data tables in the bottom. Not only it gives a fast-to-grasp summary of the Jira Kanban board via the charts, the precise data points are also shown.
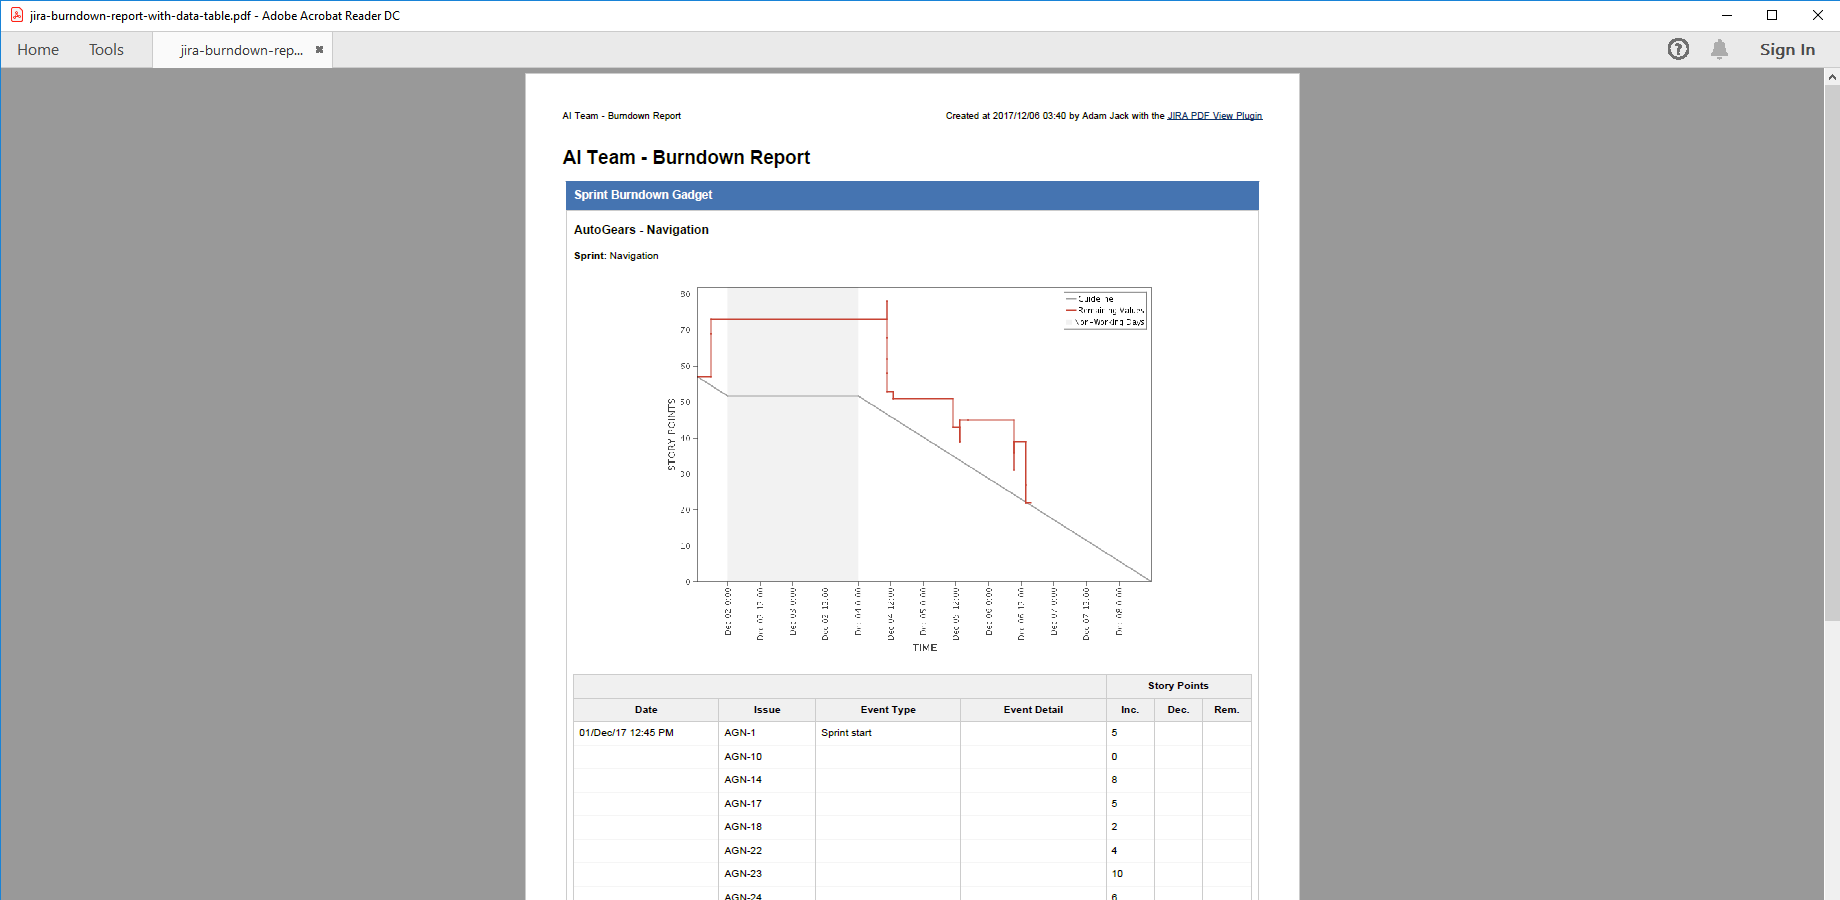
Jira reports and agile boards
When you need a built-in Jira report, a Jira Software Kanban board or a Jira Software Scrum board exported to PDF (none of these are possible with Jira built-in features!), just export its dashboard gadget equivalent along with the data table. This particular sample captures a Burndown Chart report, containing the chart and the detailed event table.
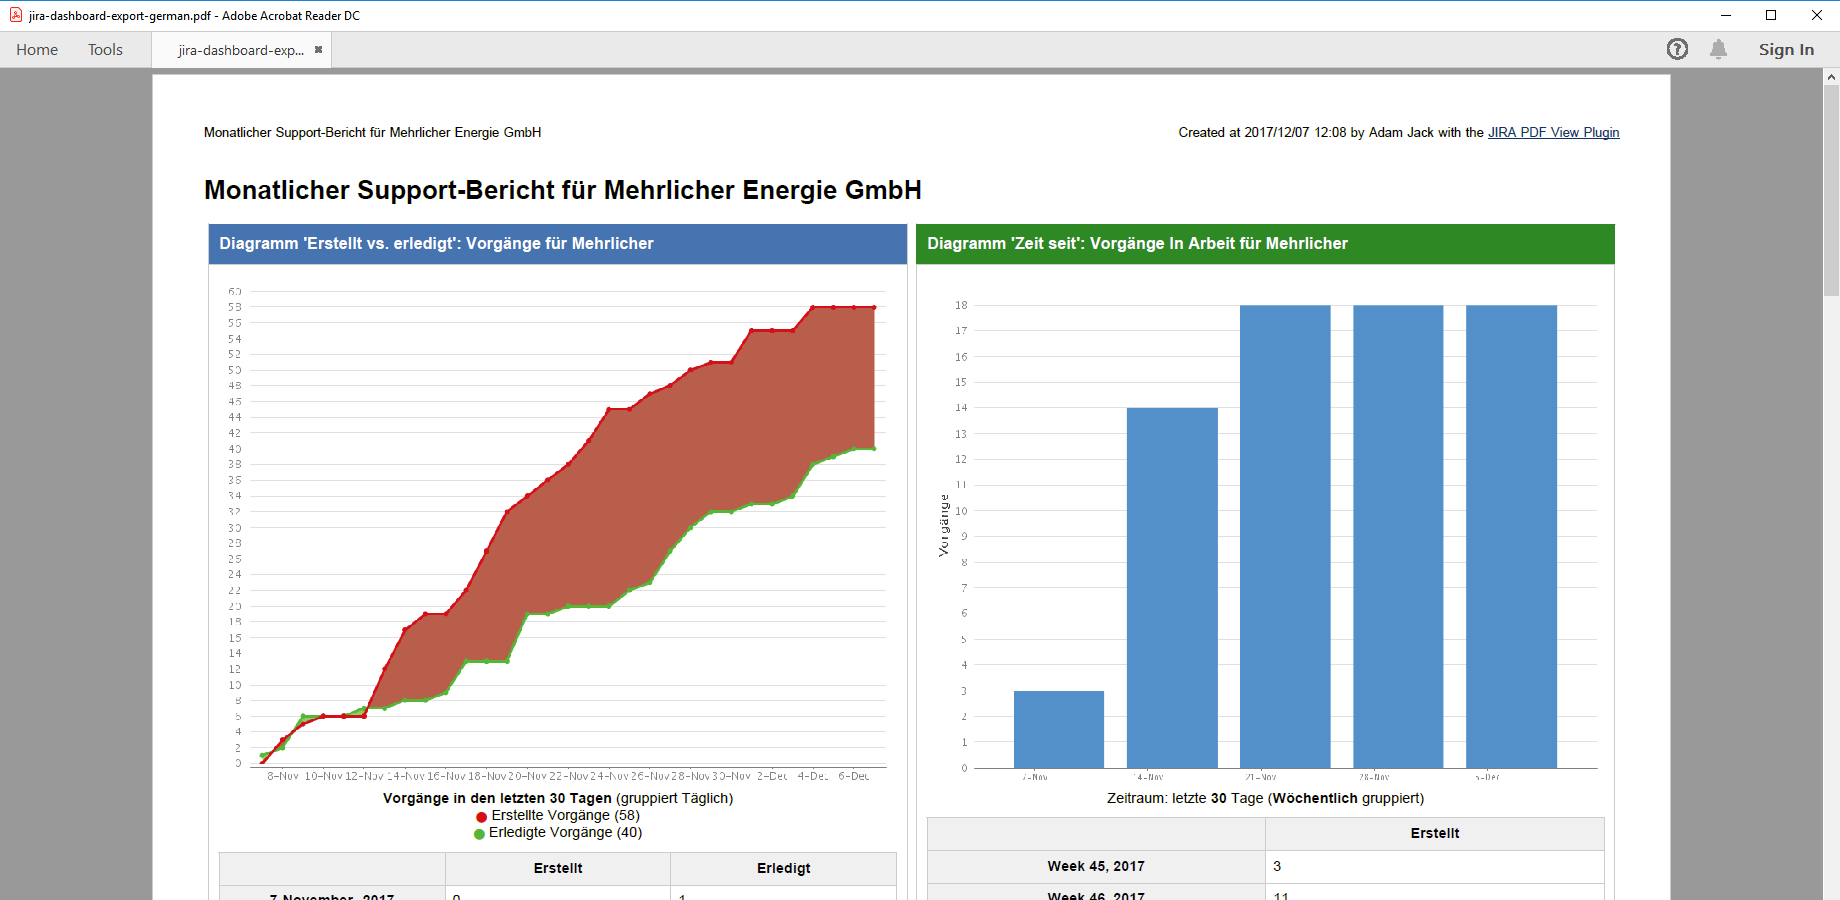
Automatic localization for dashboards & reports
Similar to all other types of Jira PDF exports, dashboard exports also use the language selected in the user's profile settings. Note that all content (including gadget titles, charts and data tables) is exported in German without any further interaction.
Learn more about Jira dashboards
See these pages in the Jira documentation:
How to export Jira dashboards to PDF?
After installing the Better PDF Exporter app, there are two ways to export dashboards: manually or automatically.
Manual exports
To create a PDF export immediately:
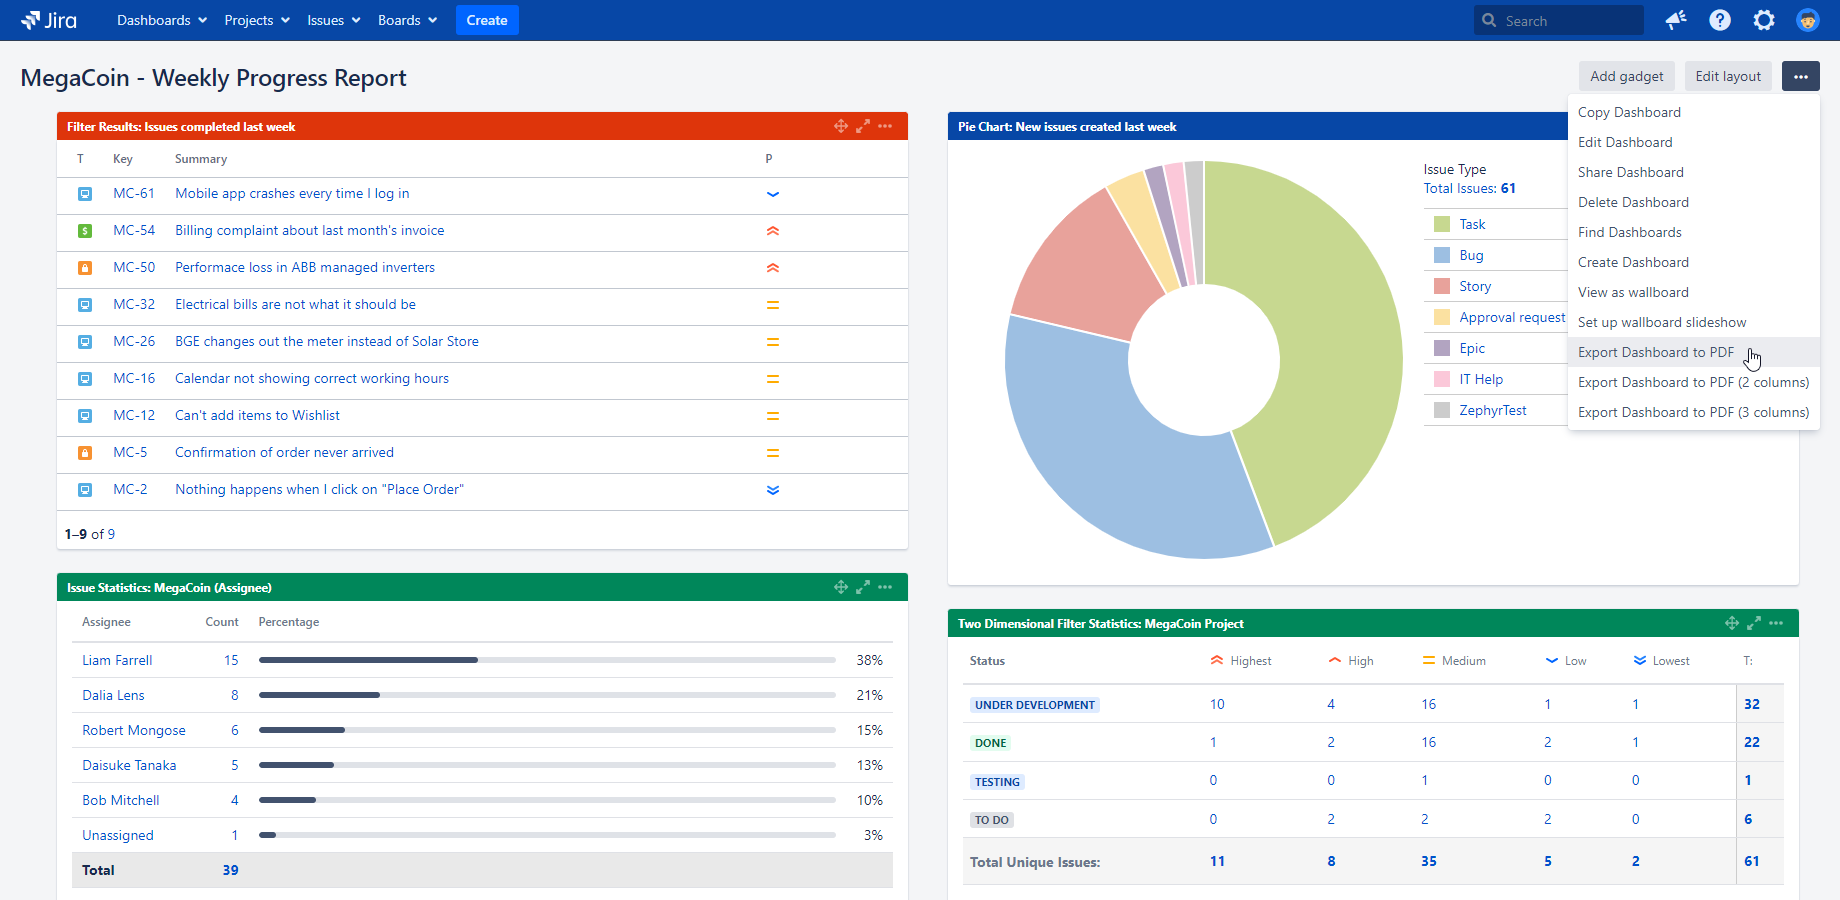
- Open the "..." menu in the top-right corner of a dashboard.
- Click "Export Dashboard to PDF". (Or use the two alternative options to export to 2- or 3-column layouts.)
- As soon as the PDF file is created, it will be automatically downloaded to your browser.
That's it!
Automatic exports
In addition to manual exports, Better PDF Exporter offers powerful automation for any type of PDF exports, also including the Jira dashboard exports.
It is possible to start automations either in regular intervals (ex: every weekday morning 8:00AM) or at certain events (ex: a new critical-priority bug is created). It is possible to automatically email, save the exported PDF documents, or attach those to Jira issues.
Automation rules are generally explained in the PDF automation tutorial.
Follow the guidance in that article with one important difference: when you configure the automation action, enter the dashboard ID to the action's Title field!
Why? Under the hood, the default dashboard PDF template (dashboard-fo.vm) will check if the dashboard ID is available as HTTP request parameter and use that (for web-based exports). If that is not available, it will use the ID provided in the $title parameter (for automations). In both cases, it will "just work".
Another difference from manual exports is that automated exports render the PDF templates directly, not via PDF views. As there is no PDF view involved in the process, its name cannot determine the layout (number of columns) for automated dashboard exports, which is the default behavior for manual exports. It means that automated exports will use the default 1-column layout, unless you re-configure that in the dashboard-fo.vm template. You can also decide to make a copy of dashboard-fo.vm as dashboard-automations-fo.vm, use a different layout in the latter, and configure all automation actions to render this specialized version.
Supported gadgets
Better PDF Exporter does not support all gadget types. As there are many gadget types with very different implementation details, supporting all would require unrealistic efforts.
Our primary goal is to support the most important gadgets which are the most probable candidates for exporting. These include e.g. the report type gadgets (like Filter Results Gadget), while exclude the convenience ones (like Quick Links Gadget).
The following gadgets are supported currently:
- Report gadgets:
- Filter Results Gadget
- Issue Statistics Gadget (since version 6.0.1)
- Two Dimensional Filter Statistics Gadget
- Chart gadgets:
- Average Age Chart Gadget
- Created vs Resolved Chart Gadget
- Pie Chart Gadget
- Recently Created Chart Gadget
- Resolution Time Chart Gadget
- Time Since Chart Gadget
- Jira Agile gadgets:
- Sprint Burndown Gadget (since version 6.0.1)
- Sprint Health Gadget (since version 6.0.1)
- Wallboard Gadget (it works great in PDF documents, just like in large wall-mounted LCD displays) (since version 6.0.1)
- Other gadgets:
- Text (free HTML content)
Replacing unsupported gadgets with supported ones
In many cases, an unsupported gadget type can be effectively replaced with a supported one. In fact, the replacement can easily be more powerful than the original one!
For example, Filter Results Gadget can replace a lot others due to the power of JQL queries:
- Assigned To Me Gadget: replace this by displaying the result of a JQL filter like assignee = currentUser()
- In Progress Gadget: display a JQL query like status = "In Progress"
- Voted Gadget: display a JQL query like issue in votedIssues()
- Watched Gadget: display a JQL query like issue in watchedIssues()
Be creative!
How are unsupported gadgets exported?
The default behavior in the dashboard-fo.vm template is that a small block with a warning text will be exported. That block will contain a convenient link to ask for the support of the missing gadget.
If you'd rather hide these blocks, just turn this variable to true in the template:
#set($skipUnsupportedGadgets = false) ## whether to completely hide the unsupported gadgets
How to ask for the support of new gadgets?
We are more than happy to add support for new gadget types depending on the priorities of the user community. You can ask for a new gadget type by sending a feature request to our support team. (If that gadget has already been requested, we will guide you to vote on the existing feature request.)
Customizing the dashboard exports
By default, the dashboard exports are rendered by merging the dashboard-fo.vm PDF template with gadget data.
To modify the content (e.g. hiding certain gadgets), to modify the layout (e.g. using two columns instead of one), to set image resolution for charts, you can simply modify the configuration variables in the top part of dashboard-fo.vm. To make more significant changes, like implementing a custom layout or a new document type, you have to actually edit the template. It is a good idea to copy the original dashboard-fo.vm and customize the copied template.
The following video demonstrates both:

For general template customizations, see this page, while the next section discusses the dashboard-specific customizations.
Configuring the layout (number of columns)
Depending on the dashboard, you may prefer different paper sizes and layouts:
- When you export a simple 1-column dashboard, a plain vanilla 1-column "A4 portrait" PDF is fine. (In this case, the gadgets stretch to the whole paper width.)
- When you export a regular 2-column dashboard, you probably want to get a 2-column "A4 landscape" PDF.
- When you export a complex 3-column dashboard, you probably want to get a 3-column "A3 landscape" PDF.
Important: if you have a 2-column dashboard and you export that to a 2-column PDF, your web layout will be 100% reproduced. It means that the gadgets will appear in the same columns also in the PDF. But, the strict equality of the column numbers is not required:
- If there are fewer columns in the PDF than in the web, then the "extra" web columns will be appended to the bottom of the last PDF column. (You can use this to export a 2- or 3-column dashboard to intuitive 1-column PDF pages, for example.)
- If there are more columns in the PDF than in the web, then the "extra" PDF columns will be simply left blank.
Generally speaking, you can set this variable in the top part of dashboard-fo.vm to the number of columns you wanted:
#set($columns = 1)
There is an additional logic that allows specifying the column count by the name of the PDF view that renders the template. It works like this: if the view name contains the substring "(N columns)" where N is an integer, then N will override the value of $columns and the output will appear in N-column layout:
## override the number of columns with N if view name contains "(N columns)"
#if($pdfView.name.matches(".*\(\d columns\)"))
	## ...
	## a new value parsed from the view name is assigned to "columns"
	## ...
#end
Therefore, if you want a N-column layout, you have the following options:
- Create a new PDF view with a name that contains "(N columns)".
- Rename an existing PDF view to a name that contains "(N columns)".
- If you want to specify the column count in the template, not in the view name, then assign a value to $columns in the template (and make sure that the PDF view's name does not contain "(N columns)"). If you need different column counts in different situations, create multiple copies of dashboard-fo.vm with different $columns value in each and use separate PDF views to render those templates.
Implementing custom layouts
Although using an N-column layout (as explained above) is perfect in most cases, you can also decide to implement your own custom layout. For example, in a branded report you can display your company name and logo in the top, then some full-width introductory text, then two gadgets in a 2-column section, then some full-width static text, then some other gadgets in a 3-column section, etc.
This is absolutely doable.
Practical hints:
- If you want to hardwire the gadget IDs to your template (making that a static template in some sense), then use tables and blocks to define the layout and render the gadgets by passing their IDs.
- If you want more dynamic behavior, then get the list of the gadget IDs in a dashboard with $gadget.getGadgetIdsByDashboard("10100"), process those if necessary, then use tables and blocks to define the layout and render each gadget where you want it.
Configuring the paper size
In the top part of dashboard-fo.vm, there is a trivial decision tree to select the "best" paper size based on the column count:
## select paper size
#if($columns == 1)
	## A4 portrait
	#set($pageWidth = "210mm")
	#set($pageHeight = "297mm")
#elseif($columns == 2)
	## A4 landscape
	#set($pageWidth = "297mm")
	#set($pageHeight = "210mm")
#else
	## A3 landscape
	#set($pageWidth = "420mm")
	#set($pageHeight = "297mm")
#end
Again, you can rewrite this to your preferences (by modifying the existing rules or adding new ones).
Configuring gadget frame colors
There is an option in the top part of dashboard-fo.vm to fill the gadget frame (top part) with the color that is configured for the web interface:
#set($useGadgetFrameColor = true)
Setting this to false will result in transparent (white) gadget headers, which make the document "more airy" (no big blocks with dark colors) and can also save ink.
Displaying the data tables for charts
Depending on your requirements, you may want to show or hide the data tables of chart gadgets. Jira dashboards typically hide those, while Jira reports, due to having more screen space, show those.
The default dashboard-fo.vm follows the dashboard conventions, and hides them. To show them, just set this variable to true:
#set($exportDataTable = false) ## whether to export the data table for gadgets which support it
In pre-6.0.1 app versions the template code was slightly different. In those, just change this line in the template:
#if(!$gadgetInfo.hasImage() && $gadgetInfo.hasContent())
...to this:
#if($gadgetInfo.hasContent())
Working with gadgets in the PDF templates
Your primary helper in the templates is the Velocity tool called $gadget.
It provides the following easy-to-use API:
| Code | What does it do? |
|---|---|
| $gadget.getDashboardIds() | Returns the list of all dashboard IDs that are visible for the current user. |
| $gadget.getDashboardInfo("10100") | Returns the details of the dashboard with the ID = 10100:
#set($dashboardInfo = $gadget.getDashboardInfo("10100"))
$dashboardInfo.id     ## identifier
$dashboardInfo.title  ## title
$dashboardInfo.layout ## layout type (A, AA, AB, etc.)
|
| $gadget.getGadgetIdsByDashboard("10100") |
Returns the list of all gadget IDs in the dashboard with the ID = 10100. It is returned in "visual" order (top to bottom within column, left to right among columns). |
| $gadget.getSortedGadgetIdsByDashboard("10100", 2) (since 6.0.1) |
Returns a "2D collection" of the gadget IDs in the dashboard with the ID=10100, laid out for a 2-column layout. In the return value, the outer list contains the columns (left to right), while inner lists contain the gadget IDs within the column (top to bottom). The layout algorithm in the PDF follows the web layout of the dashboard as much as possible. If the PDF has equal or more columns than the web, then the web layout is 100% reproduced in the PDF. If the PDF has less columns than the web, then all "additional" web columns will inserted to the bottom part of the last PDF column. |
| $gadget.getGadgetInfo("10200") | Returns the details of the gadget with the ID = 10200:
#set($gadgetInfo = $gadget.getGadgetInfo("10200"))
$gadgetInfo.id           ## identifier
$gadgetInfo.title        ## title
$gadgetInfo.hasImage()   ## whether it has an image
$gadgetInfo.hasContent() ## whether it has HTML content
$gadgetInfo.color        ## gadget titlebar color code
|
| $gadget.getValidationMessage("10200") (since 6.0.1) |
Returns a non-null string if the gadget cannot be rendered, because some technical (ex: resource not found) or configuration condition (ex: active sprint not found) is not met. If so, then the next 3 methods that produce content must not be called. |
| $gadget.getImageUrl("10200", 600, 400) (removed in 6.0.1) |
Returns the (chart) image of the gadget with the ID = 10200 in 600x400 resolution. It is returned as a data URI string so that you can use it easily with an <fo:external-graphic> element in the template:
<fo:external-graphic
content-width="10cm"
src="$gadget.getImageUrl('10200', 600, 400)"/>
Don't use this for gadgets that don't generate any image, like Filter Results, for instance.This method was removed in 6.0.1, and now the image is returned as part of the HTML content (see next method). |
| $gadget.getContentHtml("10200") |
Returns the HTML content of the gadget with the ID = 10200. This contains the chart image (if there is), the issue list, two-dimensional analytics, summary line (for charts), etc. depending on the type of gadget. It can be transformed to FO like: <fo:block> $pdfRenderer.htmlToFo($gadget.getContentHtml($gadgetId)) </fo:block> |
| $gadget.getDataTableHtml("10200") (since 6.0.1) |
Returns the HTML data table of the gadget with the ID = 10200. It can be transformed to FO like: <fo:block> $pdfRenderer.htmlToFo($gadget.getDataTableHtml($gadgetId)) </fo:block> |
Important: please note that although all identifiers are numerical, they are actually string type objects!
$gadget.getDashboardInfo("10100") ## correct
$gadget.getDashboardInfo(10100)   ## BANG! will NOT work!
(This is because Jira is internally using string type identifiers for both dashboards and gadgets, and we simply follow that convention.)
Selecting the dashboards and gadgets to export
Using the $gadget tool you can solve the most typical exporting requirements with the following control logics:
- Exporting a single dashboard: find the dashboard ID, get the gadget IDs in that dashboard, iterate over the gadgets and export the current one.
- Exporting multiple dashboards: find all dashboard IDs, iterate over them, get the gadget IDs in the current dashboard (either sorted or unsorted), iterate over the gadgets and export the current one.
- Exporting a single gadget: find the gadget ID and export the gadget.
- Exporting multiple gadgets: find all gadget IDs, iterate over the gadgets and export the current one.
When we say "export", we mean using the following macro that is available in dashboard-fo.vm:
## macro to render a gadget
#macro(gadgetBlock $gadgetId)
	## ...
#end

## usage
#gadgetBlock("10200")
You will be able to create any sort of custom dashboard export based on this guidance. For instance: under your company logo you can display gadgets in a 2-column layout with both the chart image and the related data table.
Please study the default dashboard-fo.vm template for a full, working example and make sure you read the template development guide.
How can I find out the ID of a dashboard?
When you view a dashboard in your browser, the URL in your browser's address bar typically ends like this: /secure/Dashboard.jspa?selectPageId=10310. The number 10310 is the ID of that specific dashboard you are looking at.
When you look at the system default dashboard, the ?selectPageId=10310 part may be missing from the end of the URL. No problem, just use the Export Dashboard Details (PDF) view as explained in the next section. It will show you both the dashboard ID and all gadget IDs in that dashboard.
How can I find out the ID of a gadget?
If you are curious about the ID of a gadget, enable the view called Export Dashboard Details (PDF). This "for developers" type view is created automatically in disabled state, because it is only needed by template developers for inspecting the gadget IDs.
This view renders the dashboard-details-fo.vm template, which exports a PDF document that displays the dashboard details (including its ID) the gadget details (IDs and other metadata) in the current dashboard. Think of this as a simple visual helper and debugger tool.
Questions?
Ask us any time.