
In this page
Tag basics
Taglibs
The "jt" taglib
<jt:forEach>
Examples
Alternative: implicit iteration
<jt:group>
Examples
Grouping static columns
Grouping static rows
Grouping dynamic rows
Complex multi-level groups
Resources
<jt:if>
With a body
Examples
Bodiless form
Examples
<jt:hyperlink>
Examples
Resources
<jt:formula>
Examples
<jt:comment>
Examples
Resources
<jt:style>
Examples
<jt:hideCols>, <jt:hideRows>, <jt:hideSheet>
Examples
The "mt" taglib
<mt:execute>
Examples
<mt:celltype>
Examples
<mt:autosize>
Limits
Examples
<mt:class>
Examples
Next step
What are tags?
Tags are used to control the Excel template rendering process.
These are special syntax elements that you write in the Excel cells, and which will automatically be detected and evaluated by the app. Each tag has its own well-defined purpose, like stepping over a collection of issues, rendering a hyperlink type cell or adding native Excel comments to a cell. Please see the detailed description of the tags in the next main section.
Tag basics
If you are familiar with the basics of the HTML or the XML language (tags, attributes and so), you can skip this section. If not, please read on to get familiar with the core concepts quickly.
Tags can receive parameters via their so-called attributes. An attribute is a pair of an attribute name and a value. For example, to tell what comment to insert into a cell with the <jt:comment> tag, you define the comment attribute and assign a text value:
| <jt:comment comment="Hello world!"/> |
There are two types tags, based on whether they encapsulate some "body":
-
Bodiless tags don't encapsulate any body.
They are single instances that should be evaluated locally ("right in the cells where they are") and not to be applied to a range of cells.
Example: the <jt:comment> tag in the previous example is a bodiless tag. -
Tags with bodies are composed of opening tags and closing tags.
Between those two, there is a range of body cells. The tag is typically applied to this well-defined range.
Example: the <jt:forEach> may enclose a body.
Some tags support both with-body and bodiless forms, like <jt:if>.
Taglibs
Tags are logically grouped into so-called taglibs. From user's point of view, the only difference between taglibs is the prefix that introduce a concrete tag. For instance, the tags in the base taglib are introduced with <jt:>, while the tags in the advanced taglib are introduced with mt:.
The "jt" taglib
<jt:forEach>
Steps over a list (collection) of data, like the list of issues, the list of fix versions of a single issue or the comments of a single issue.
You specify the collection in the items attribute and the name of the variable that will hold the current item in var.
Important: it is critical to understand the "scope" of the iteration. The variable specified by the var attribute will be valid only in the cell range, whose top-left corner is specified by the opening tag and whose right-bottom tag corner is specified by the closing tag. Outside that rectangle (ex: left or above the opening tag or right or bottom the closing tag), var is not available!
For the advanced features of the <jt:forEach> tag, check out this article.
Examples
| Key                                                    | Summary          | Assignee                       |
| <jt:forEach items="${issues}" var="issue">${issue.key} | ${issue.summary} | ${issue.assignee}</jt:forEach> |
Alternative: implicit iteration
Iterating over data using the <jt:forEach> tag is called the explicit way of iteration.
Its alternative is called implicit iteration which may be easier to use, albeit less flexible. For details and comparison, see this section.
<jt:group>
Creates a group (outline) of columns or rows that can be opened and closed with a single click in Excel. Outlines are primarily used to group and summarize detail data for a master row or column in a worksheet.
There are two different ways of creating groups:
- Static: the <jt:group> tag should be used when the column or rows to be grouped are "statically existing" in the template, prior to the rendering.
- Dynamic: if the columns or rows to be grouped are created dynamically during the rendering (by iterating over a collection of issues, for example), the groupDir parameter of the <jt:forEach> tag should be used.
You can download the Excel templates for the examples below in the resources section.
For even more details on the parameters and for more examples, also check out the Group Tag page in the JETT documentation.
Examples
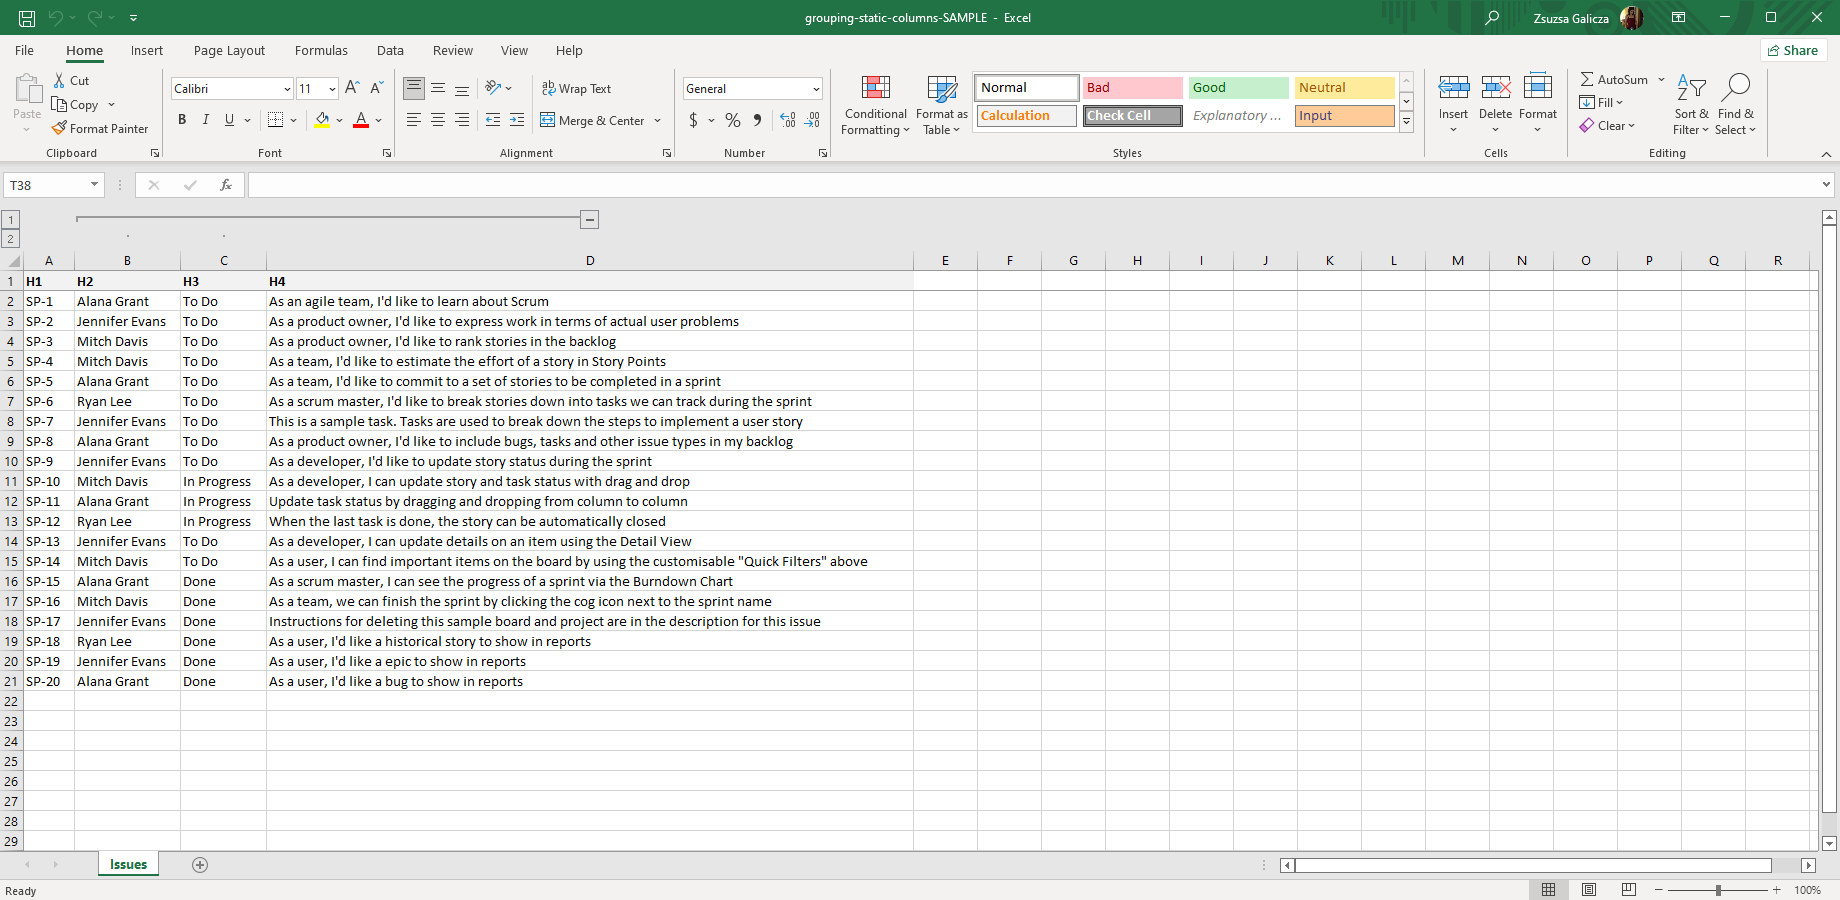
Grouping static columns
In this example, the static columns B and C are grouped:
|         A        |                      B                       |       C       |       D       |
+------------------+----------------------------------------------+---------------+---------------|
| H1               | <jt:group groupDir="cols" collapse="true">H2 | H3</jt:group> | H4            |
| <jt:forEach ...> | ...                                          | ...           | </jt:forEach> |
Note that in the result spreadsheet, the group will be in closed state due to the collapse="true" parameter (unlike in the screenshot below).
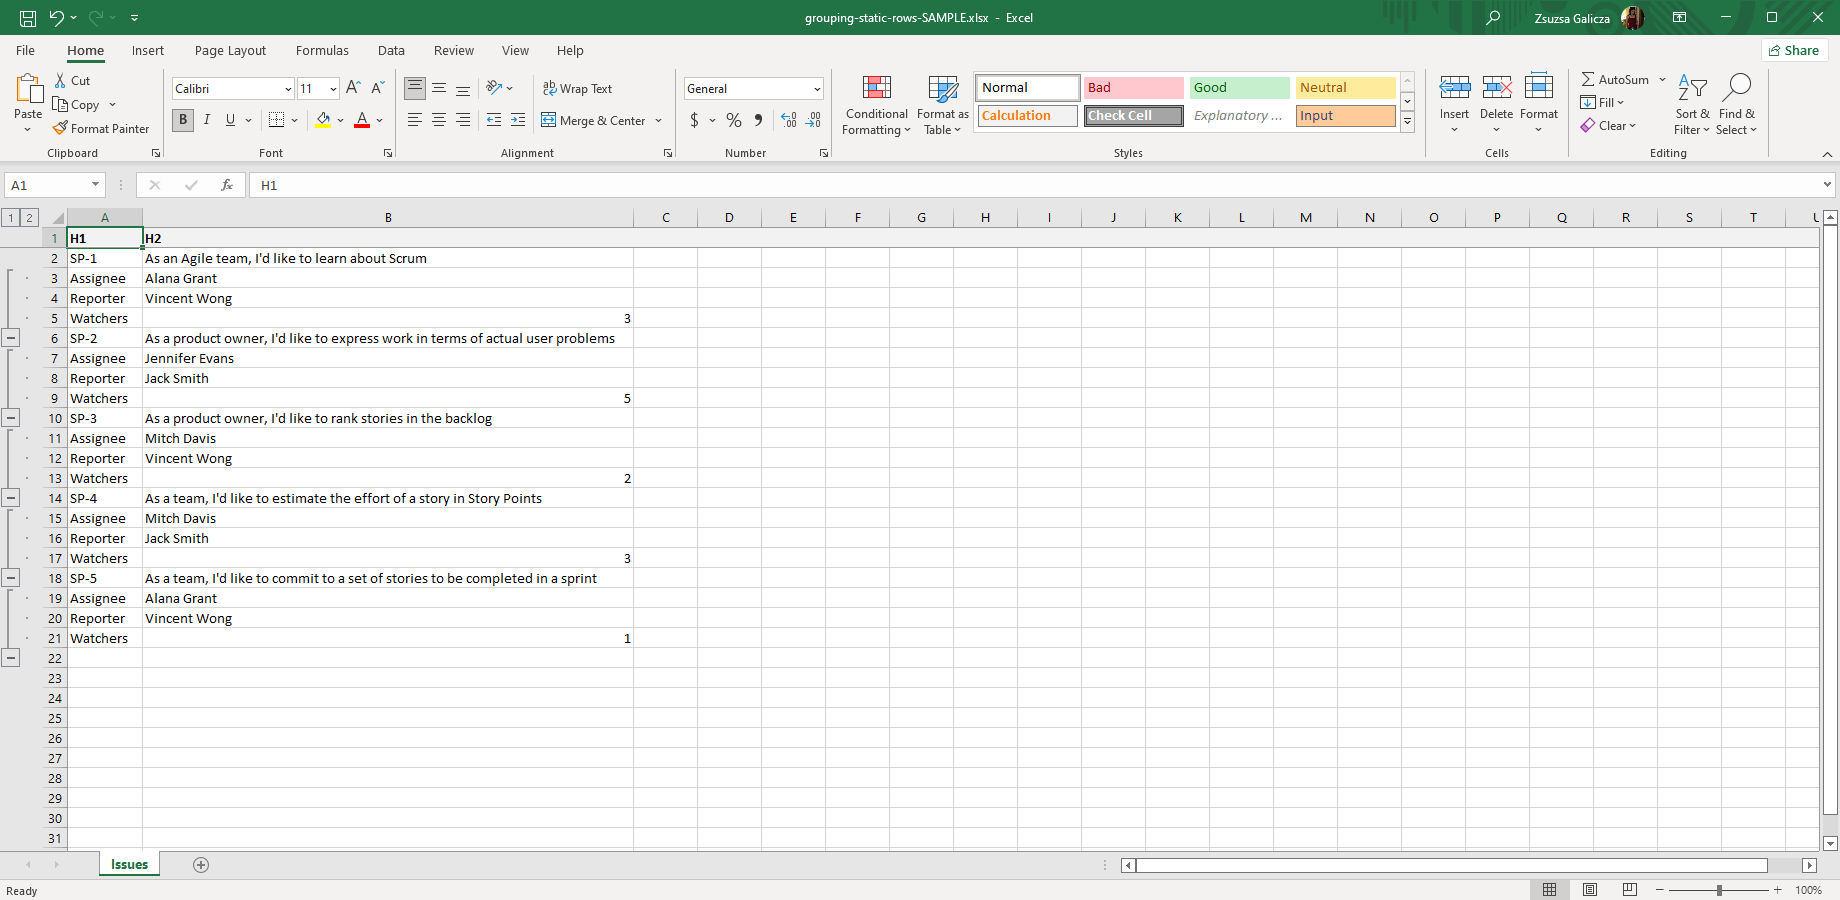
Grouping static rows
In this example, exactly 3 rows (containing detail data under a master row) are grouped inside a vertical iteration:
|                A              |              B                        |
+-------------------------------+---------------------------------------|
| H1                            | H2                                    |
| <jt:forEach ...>${issue.key}  | ${issue.summary}                      |
| <jt:group>Assignee            | ...                                   |
| Reporter                      | ...                                   |
| Watchers                      | .... </jt:group></jt:forEach>         |
Please note that even if the 3 rows are static in the template, they will be multiplicated by the outer iteration and each instance will become a group on its own:
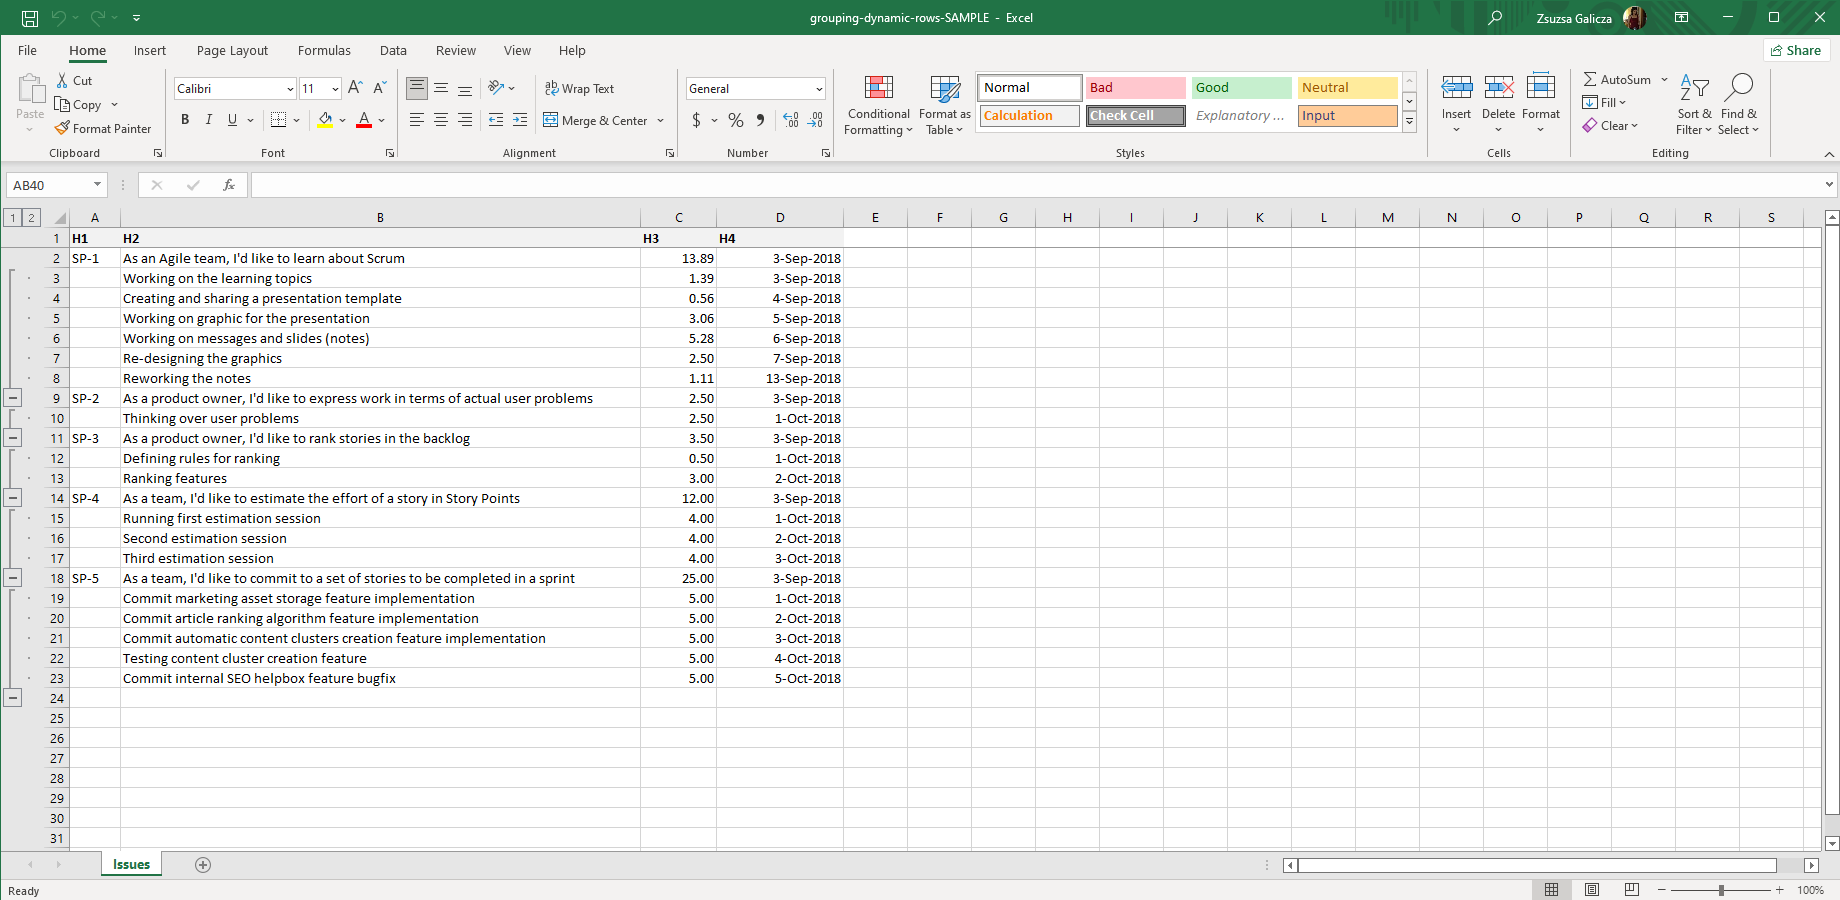
Grouping dynamic rows
This example shows how to group dynamically created rows by a <jt:forEach> iteration:
|          A          |                   B                 |  C  |              D                |
+---------------------+-------------------------------------+-----+-------------------------------|
| H1                  | H2                                  | H3  | H4                            |
| <jt:forEach ...>... | ...                                 | ... | ...                           |
|                     | <jt:forEach ... groupDir="rows">... | ... | ...</jt:forEach></jt:forEach> |
It will render groups with varying number of rows:
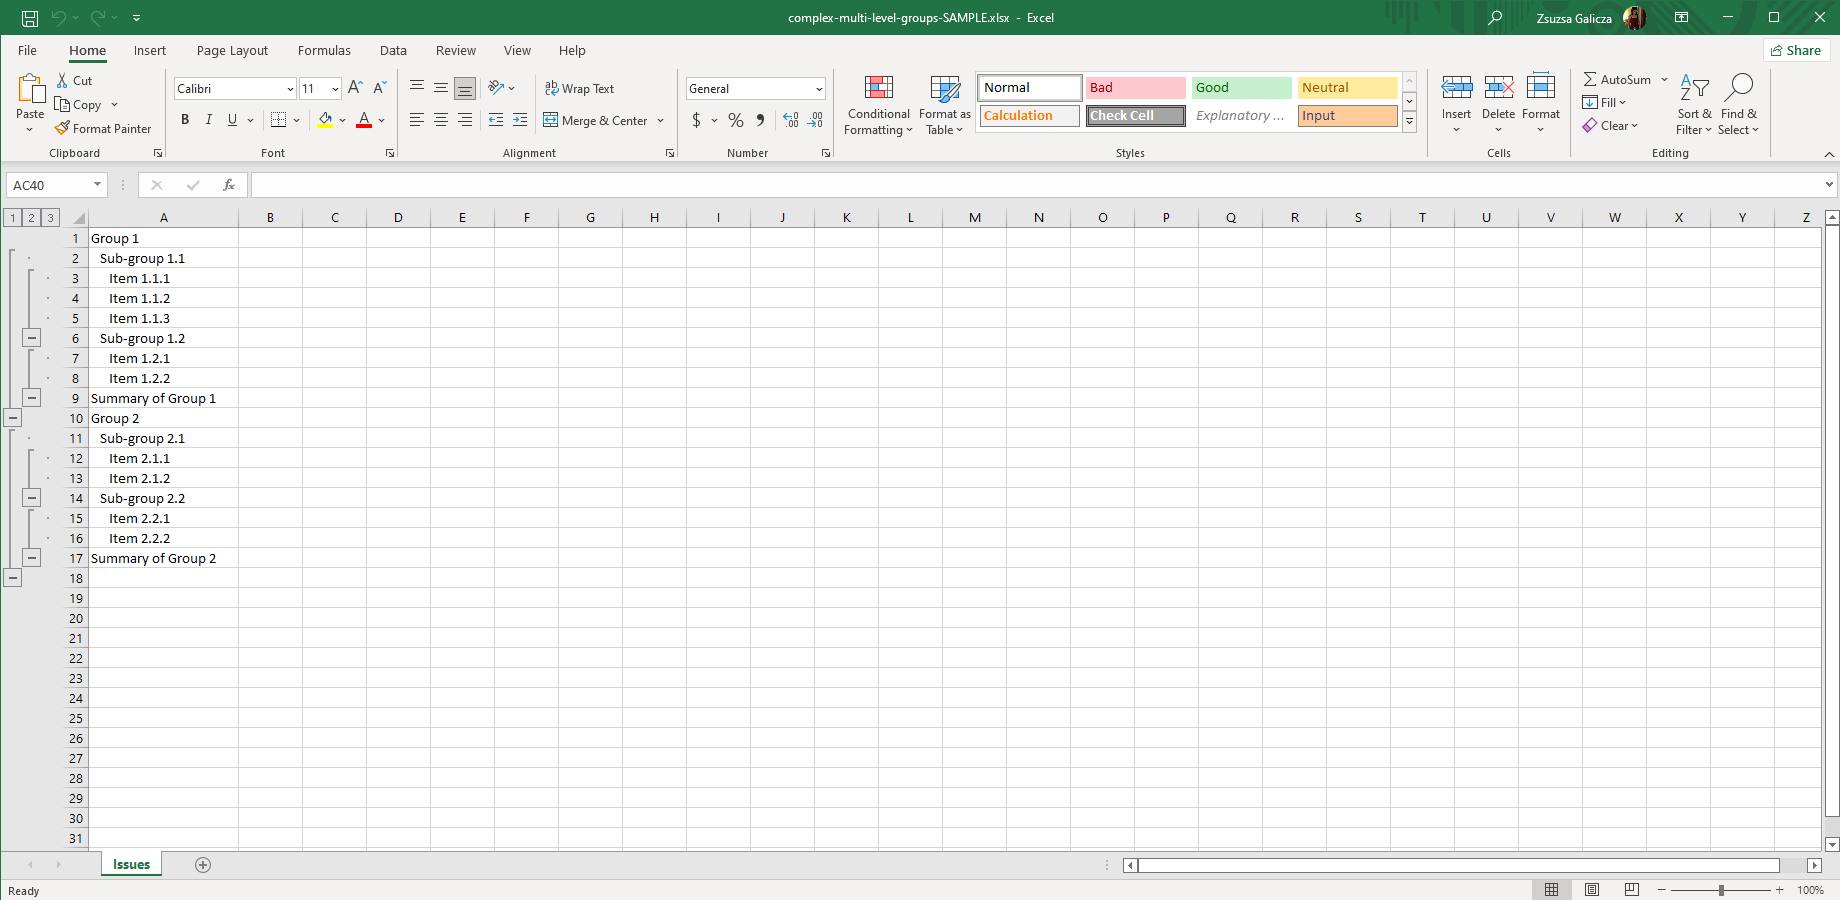
Complex multi-level groups
Multi-level groups can be created simply by nesting <jt:group> tags in multiple levels of depth.
In this example, we are creating 3 levels from static cells for sake of simplicity:
|                  A                   |
+--------------------------------------|
| Group 1                              |
| <jt:group>Sub-group 1.1              |
| <jt:group>Item 1.1.1                 |
| Item 1.1.2                           |
| Item 1.1.3</jt:group>                |
| Sub-group 1.2                        |
| <jt:group>Item 1.2.1                 |
| Item 1.2.2</jt:group>                |
| Summary of Group 1</jt:group>        |
| Group 2                              |
| <jt:group>Sub-group 2.1              |
| <jt:group collapse="true">Item 2.1.1 |
| Item 2.1.2</jt:group>                |
| Sub-group 2.2                        |
| <jt:group collapse="true">Item 2.2.1 |
| Item 2.2.2</jt:group>                |
| Summary of Group 2</jt:group>        |
In the final spreadsheet, the group-type items under "Group 2" will be in closed state due to the collapse="true" parameter (unlike in the screenshot below).
Resources
![]() grouping-static-columns-template.xlsx — a sample Excel template for grouping static columns.
grouping-static-columns-template.xlsx — a sample Excel template for grouping static columns. ![]() grouping-static-rows-template.xlsx — a sample Excel template for grouping static rows.
grouping-static-rows-template.xlsx — a sample Excel template for grouping static rows. ![]() grouping-dynamic-rows-template.xlsx — a sample Excel template for grouping dynamic rows.
grouping-dynamic-rows-template.xlsx — a sample Excel template for grouping dynamic rows. ![]() complex-multi-level-groups-template.xlsx — a sample Excel template for creating complex multi-level groups.
complex-multi-level-groups-template.xlsx — a sample Excel template for creating complex multi-level groups.
<jt:if>
Conditionally processes content. It can be used in two ways: with a body or a without a body (also known as a bodiless form).
In both forms, the test attribute is required and it must evaluate to a boolean true or false or the corresponding "true" or "false" strings.
With a body
In this form, the body surrounded by the <jt:if> and </jt:if> tags will be processed if the attribute test evaluates to true. The enclosed block may consist of multiple cells.
The optional elseAction attribute specifies what to do if test evaluates to false. You can clear, remove or shift content with this setting. For details, check out the JETT documentation here.
Examples
| <jt:if test="${assignee.emailAddress != null}"> | ${assignee.name} | ${assignee.emailAddress} | </jt:if> |
Bodiless form
In this form, apart from the mandatory test attribute, you can specify two expressions in the then and else attributes.
Examples
| <jt:if test="${assignee.emailAddress != null}" then="${assignee.name}" else="Invalid" /> |
<jt:hyperlink>
Renders a link type cell. It can link to a URL (web address), an email address or to another cell in the Excel spreadsheet.
Please note that it does not affect the cell's visual properties. Add blue color, underlining or some other visual hint that suggests that it is a link cell.
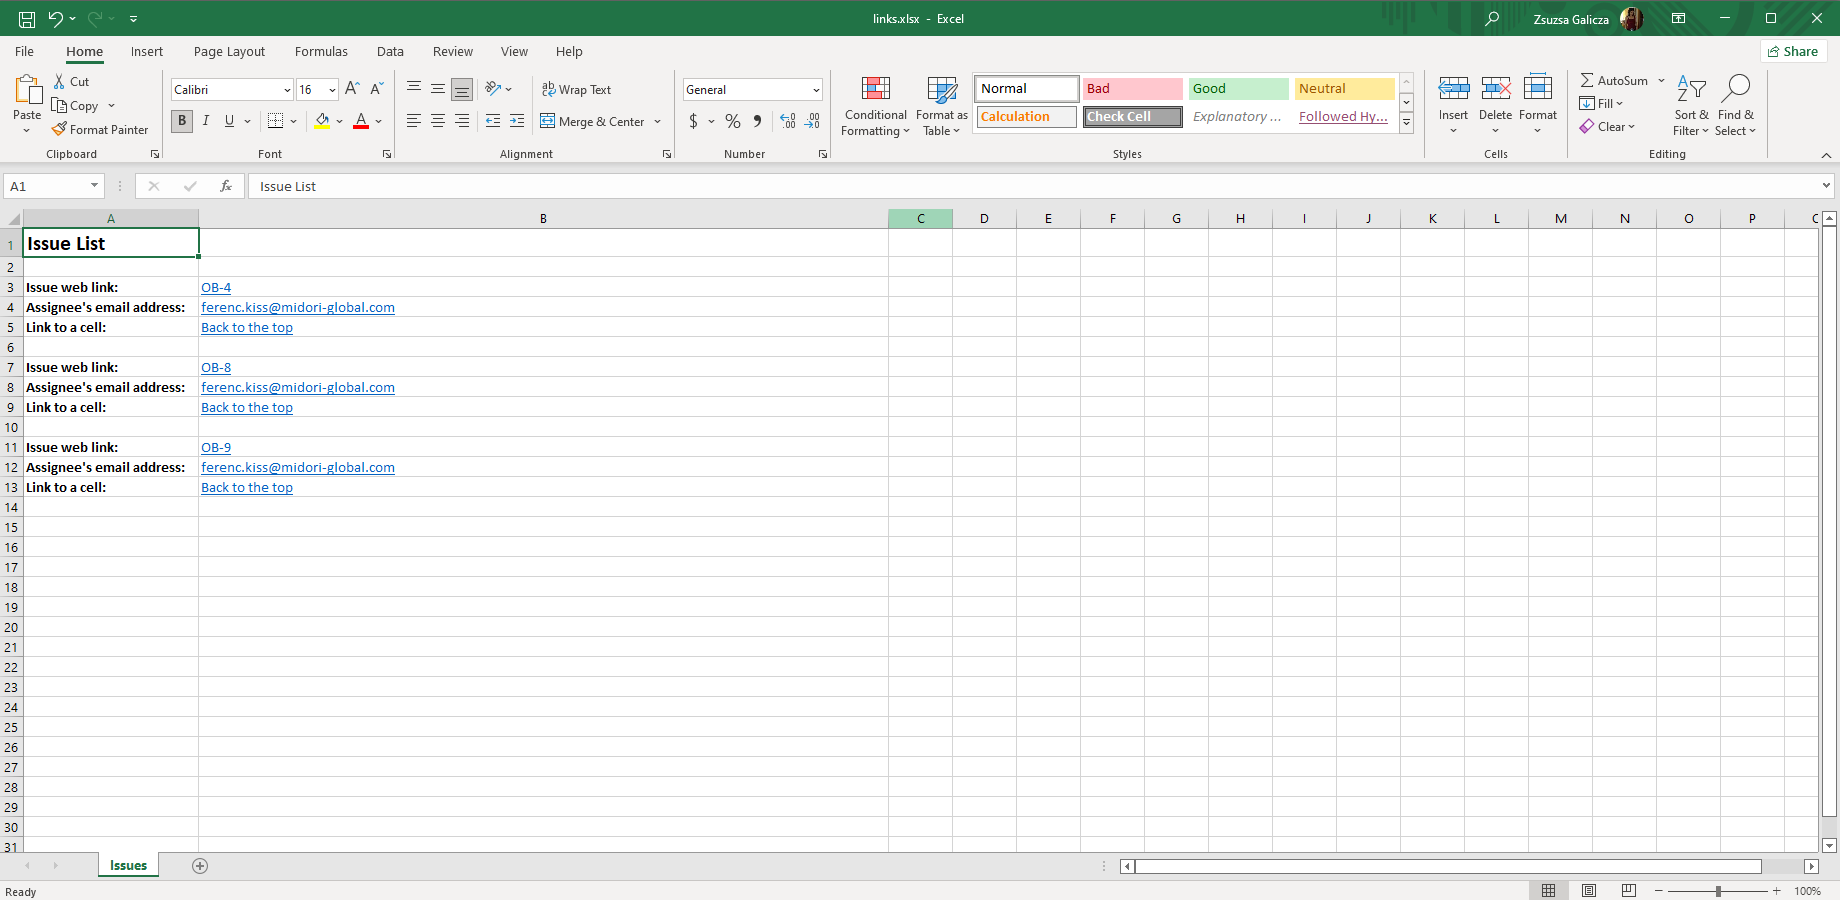
Examples
| Issue web link:            | <jt:hyperlink address="${requestContext.canonicalBaseUrl}/browse/${issue.key}" value="${issue.key}"/>                       |
| Assignee's email address:  | <jt:hyperlink type="email" address="mailto:${issue.assigneeUser.emailAddress}" value="${issue.assigneeUser.emailAddress}"/> |
| Link to the top-left cell: | <jt:hyperlink type="doc" address="'Issues'!A1" value="Back to the top"/>                                                  |
Resources
![]() hyperlink-tag-template.xlsx — a sample Excel template for the <jt:hyperlink> tag.
hyperlink-tag-template.xlsx — a sample Excel template for the <jt:hyperlink> tag.
<jt:formula>
This bodiless tag creates an Excel formula. This is different from the formulas created using the square brackets syntax in the following ways:
- <jt:formula> can use JEXL expressions, therefore the formula can rely on context objects. But, its cell references are not processed, for example when being in the body of a <jt:forEach> iteration.
- Square bracket formulas cannot contain JEXL expressions. But, its cell references are intelligently processed, so they work even in <jt:forEach> iterations.
Examples
| <jt:formula text="${numerator} / ${denominator}" ifError="Division by zero" /> |
If numerator=5 and denominator=10, then this cell displays 0.5. And when you click it, it reveals the formula:
| = 5 / 10 |
<jt:comment>
Adds a native Excel comment to the cell. The value attribute specifies the cell's main content.
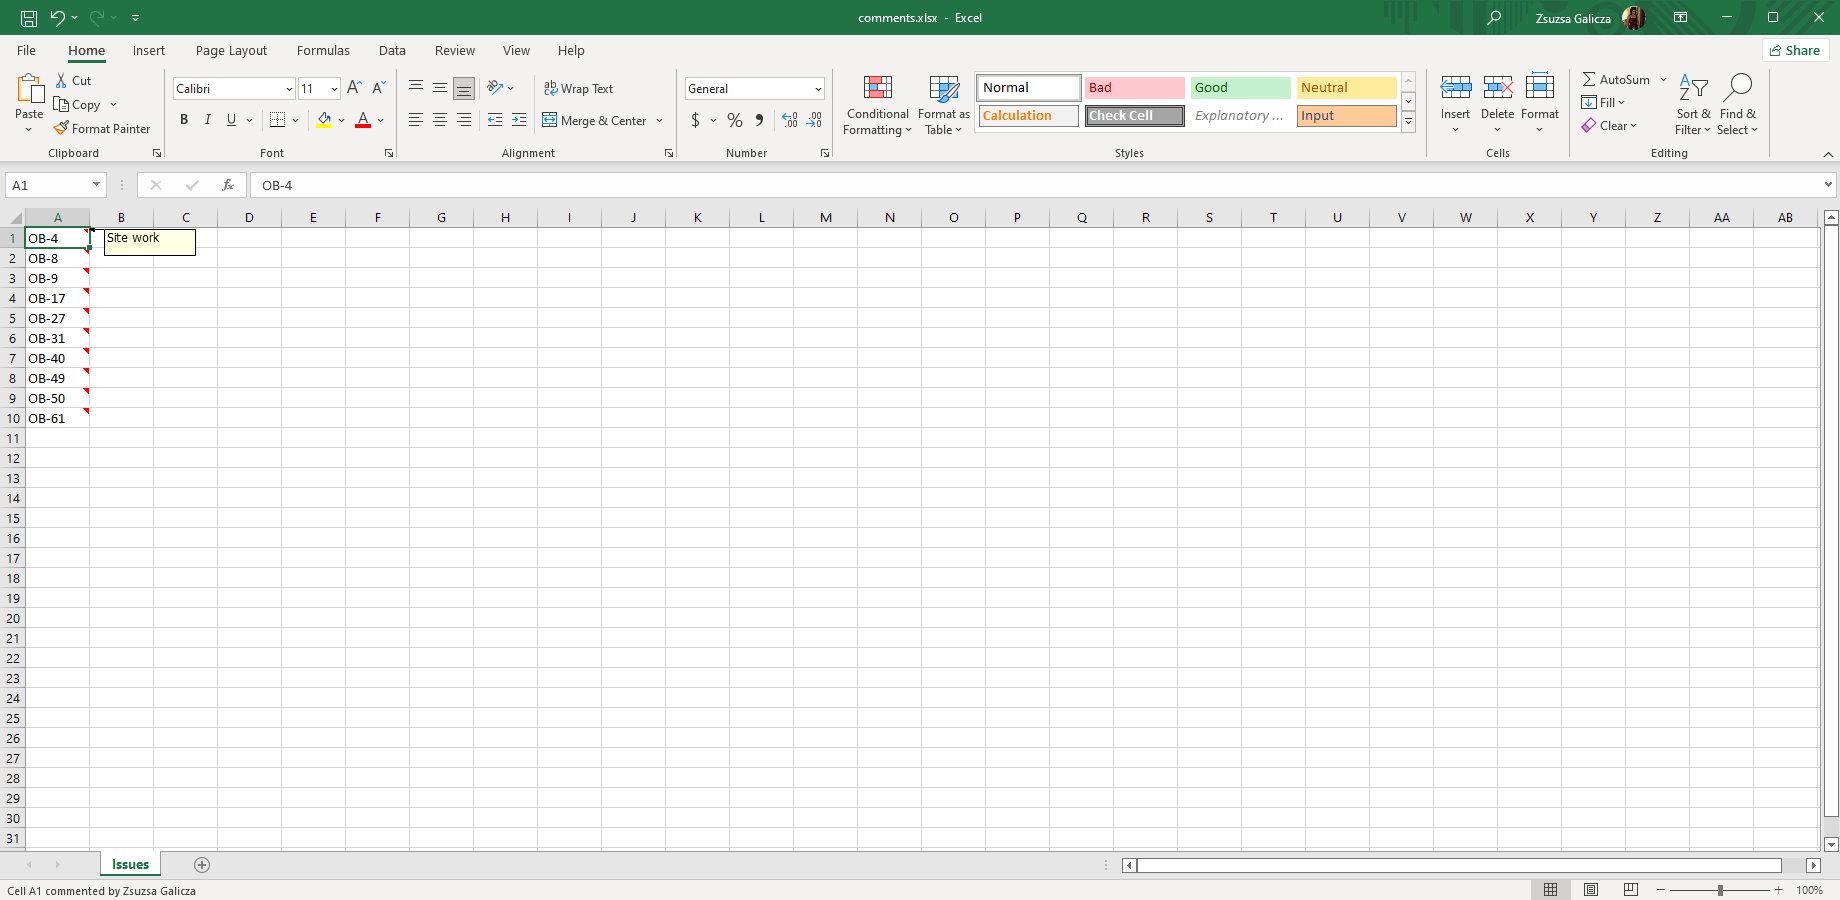
Examples
| <jt:comment value="${issue.key}" author="${issue.reporter.displayName}" comment="${issue.summary}"/> |
Resources
![]() comment-tag-template.xlsx — a sample Excel template for the <jt:comment> tag.
comment-tag-template.xlsx — a sample Excel template for the <jt:comment> tag.
<jt:style>
Adds a (dynamic) style to the cell.
Generally speaking, all Excel formatting and styling in the template is preserved during export. For instance, if you define a template cell with red background color and italic font, then it will keep its look in the exported spreadsheet, too. This is the simplest and most efficient way of adding styles, and you should definitely use this, if this type of static styling is sufficient to your needs.
In some cases, you might need to generate styling dynamically. For instance, you may want to manipulate the colors in a cell as a function of some Groovy computation. That is where this tag comes to play, because it enables evaluating dynamic expressions (and calling a Groovy method) to define styles.
The optional style attribute allows you to specify elements in a property1:value1; property2:value2 format. You can use a wide range of style attributes, similarly to the CSS language.
The other optional class attribute allows you to refer to a class previously created with the class tag.
Examples
Using a one-time only style:
| <jt:style style="color:red; font-weight:bold">Beware! Too many issues!</jt:style> |
Creating a reusable style:
| <mt:class name="warning" style="color:red; font-weight:bold"/>       |
| <jt:style class="warning">Warning! User name is invalid!</jt:style>  |
| <jt:style class="warning">Beware! Too many issues!</jt:style>        |
<jt:hideCols>, <jt:hideRows>, <jt:hideSheet>
These tags can conditionally hide columns, rows or entire worksheets from a workbook.
For each of them, the expression provided in the mandatory test attribute decides whether to show (false) or hide (true) the corresponding content:
- <jt:hideCols>: shows/hides the columns enclosed by the opening and closing tags
- <jt:hideRows>: shows/hides the rows enclosed by the opening and closing tags
- <jt:hideSheet>: shows/hides the entire worksheet that contains the tag
Please note that the original visibility does not matter. For example:
- If a row was hidden and contains <jt:hideRows test="false">, it will become visible.
- If a row was hidden and contains <jt:hideRows test="true">, it will remain hidden.
- If a row was visible and contains <jt:hideRows test="false">, it will remain visible.
- If a row was visible and contains <jt:hideRows test="true">, it will become hidden.
Examples
Hide columns from B to D (inclusive):
| A |              B            |   C   |        D       | E |
|---+---------------------------+-------+----------------+---|
|   | <jt:hideCols test="true"> | 12345 | </jt:hideCols> |   |
Hide rows 2 and 3:
|   |              A            |  |
|---+---------------------------+--|
| 1 |                           |  |
| 2 | <jt:hideRows test="true"> |  |
| 3 | </jt:hideRows>            |  |
| 4 |                           |  |
Hide the entire worksheet:
| Foo | Bar | <jt:hideSheet test="true"></jt:hideSheet> |
The "mt" taglib
<mt:execute>
Executes a Groovy script, which can add refined logic to the template.
Scripts can be used for data processing (ex: finding the status update records in an issue change history), for accessing Jira internals (like Jira Agile sprint information), or for data integration (ex: loading data from an external database or web service), for example.
You can make the execution conditional using the optional test attribute, which allows you defining a boolean expression. The script will be executed only if this expression evaluates to true. This technique can save valuable computation time if the script is needed only for a subset of the exports. ("test" is supported since Better Excel Exporter 5.2.0)
Examples
Just execute the script:
| <mt:execute script="workflow-analysis.groovy"/> |
Execute the script only if the export is initiated from the Structure screen:
| <mt:execute script="structure-tool.groovy" test="${xlsViewContext == 'STRUCTURE'}"/> |
Please see the scripting section for more details.
<mt:celltype>
Sets the data type of the cell explicitly.
This should be used rarely, because in most cases the cell type can be and can be specified directly in the template itself! For example, if you know that the cell "A4" (and all other cells derived from this) will be a date type cell, then just right-click "A4"" in Excel while editing the template and set its format to your preferred date format.
In some cases though, this is not known beforehand which cell will contain what type of data. The most typical example for this is the issue-navigator.xlsx template (and all other issue-navigator-*.xlsx variants), which relies on the dynamical column configuration currently selected in Issue Navigator. Using this template, you cannot know at the template editing time if column "A" will be a Summary column (string) or Due Date (date). This is where the <mt:celltype> tag helps. Unless you develop a template with this type of "dynamic columns" behavior, then you can completely ignore this tag.
It works in two steps.
First, you insert the <mt:celltype> tag to the column (which is assumed to contain data of the same type!) and pass the following parameters:
- type: "string", "number", "date" or "link"
- format: specify the format using the Excel format codes (only used for the "number" and "date" types, ignored for others)
You will most likely do this within a <jt:forEach> iteration and you can calculate both parameter values dynamically, based on the field ID of the Jira table layout column which will be exported to this Excel column. This is exactly what the issue-navigator.xlsx template does:
| <jt:forEach items="${issueNavigator.issueTableLayout.columns}" var="columnLayoutItem" copyRight="true" copyColumnWidthsRight="false">
	${i18n.getText(columnLayoutItem.navigableField.columnHeadingKey)}
	<mt:celltype type="${issueNavigator.getFieldCellType(columnLayoutItem)}" format="${issueNavigator.getFieldFormat(columnLayoutItem)}"/>
</jt:forEach> |
Please note that the tag itself does nothing else, but registers that the given column will contain e.g. numbers in the given format.
As second step, you export the field values with another <jt:forEach> iteration that also invokes the ${cellTypeTagLoopListener} tag loop listener:
| <jt:forEach items="${issueNavigator.issueTableLayout.columns}" var="columnLayoutItem" copyRight="true" copyColumnWidthsRight="false" onLoopProcessed="${cellTypeTagLoopListener}">
	${issueNavigator.getFieldValue(issue, columnLayoutItem)}
</jt:forEach> |
The cell tag loop listener will be called at each step of the iteration, take the format previously calculated by <mt:celltype> the tag and apply that to the current cell.
Examples
See the how-to in the section above.
<mt:autosize>
Resizes rows, columns or both in a worksheet so that their cells fit the content. This can be used to "optimize" the layout in the final spreadsheets.
This will resize cells using their content that is available when the processor reaches the tag. It means that you typically want to place this tag in the "bottom part" of your sheet, to be sure that it would be processed after all actual cells were filled with their final value. Please note that this tag may increase the time required to compile the final spreadsheet, therefore consider fitting columns only or rows only - especially if you're exporting large data sets.
You can also set the preferred amount of column padding by passing a positive number like "2" (or even "2.75") to the whiteSpace parameter. After calculating the actual width from the actual cell content, there will be extra space added for 2 (or 2.75) additional characters and that width will be set for the column. Tip: if your cell content wraps to multiple lines unwantedly, you can increase the column width this way to eliminate wrapping! (since Better Excel Exporter 3.0.0)
Limits
As this is relatively slow to check the content of each cell in a spreadsheet with hundreds of thousands of cells, two optional parameters can be used to significantly reduce the autosizing time. (since Better Excel Exporter 3.0.0)
These assume that even if you have 1000 rows in a spreadsheet, there is no drastic variance in the "size" of the data (e.g. the lengths of the status names) along all the 1000 rows. Therefore you can quickly get a good approximation of the optimal column width by checking the first N unique cell values only. For example, the tag can start checking the cells in the column from top to bottom and stop when it finds the 20th unique status name. And then calculate the column width based on those 20 status names.
Related tag parameters:
- columnLimit: the number of the topmost unique values to check to find the widest cell in a column (default: 50)
- rowLimit: the number of the leftmost unique values to check to find the tallest cell in a row (default: 10)
Notes:
- When any of these parameters is omitted, the default values (above) are used.
- When any of the parameters is set to 0, then all rows or all columns are used (best result, slowest case).
- These parameters only limit the number of unique value that are checked to find the optimal size. Then the optimal size is applied to all cells.
- If the names don't seem intuitive for the first look, the underlying logic is: rowLimit means "limit for the unique value count to find the optimal row height".
Examples
Resizing both columns and rows (using the default limits and white space):
| <mt:autosize/> |
Resizing columns only with 3 character white space (padding):
| <mt:autosize rows="false" whiteSpace="3"/> |
Resizing rows only:
| <mt:autosize columns="false"/> |
Resizing columns only based on the first 3 unique values:
| <mt:autosize rows="false" columnLimit="3"/> |
Resizing both rows and columns based on the first 3 or 5 unique values respectively:
| <mt:autosize columnLimit="3" rowLimit="5"/> |
Resizing both rows and columns based on all the values (slowest):
| <mt:autosize columnLimit="0" rowLimit="0"/> |
<mt:class>
Defines a style class that can be later referenced using the <jt:style> tag.
If you plan to use the same visual style multiple times, defining that once and referencing that with the jt:style tag multiple times is much more efficient than adding the same style attributes to multiple cells.
This tag has two required attributes. name specifies the reusable identifier for the style group (similar concept to CSS classes), and style describes the concrete styling rules.
Examples
| <mt:class name="warning" style="color:red; font-weight:bold"/> |
| <jt:style class="warning">Beware! Too many issues!</jt:style>  |
Next step
Run short Groovy scripts to integrate data from external resources (external database or API), to access Jira internals (ex: getting project or version metadata) or to pre-process data before exporting that to Excel.
Questions?
Ask us any time.